Profit margin formula: how to calculate your margins
Get the gross, operating and net profit margin formulas, with worked dollar examples showing how to use each one.
Written by Lena Hanna—Trusted CPA Guidance on Accounting and Tax. Read Lena's full bio
Published Tuesday 6 October 2026
Table of contents
Key takeaways
- Gross, operating, and net profit margins each divide a profit figure by revenue and multiply the result by 100
- Pricing for a target margin means dividing your costs by (1 − target margin), so $5,000 in costs at 20% needs a $6,250 price
- A 10% net profit margin is generally healthy, 20% is strong, and 5% is on the low side, but benchmarks vary widely by industry
- Cost control and smarter pricing lift your margins, while tracking trends over time helps you spot changes early
What is a profit margin?
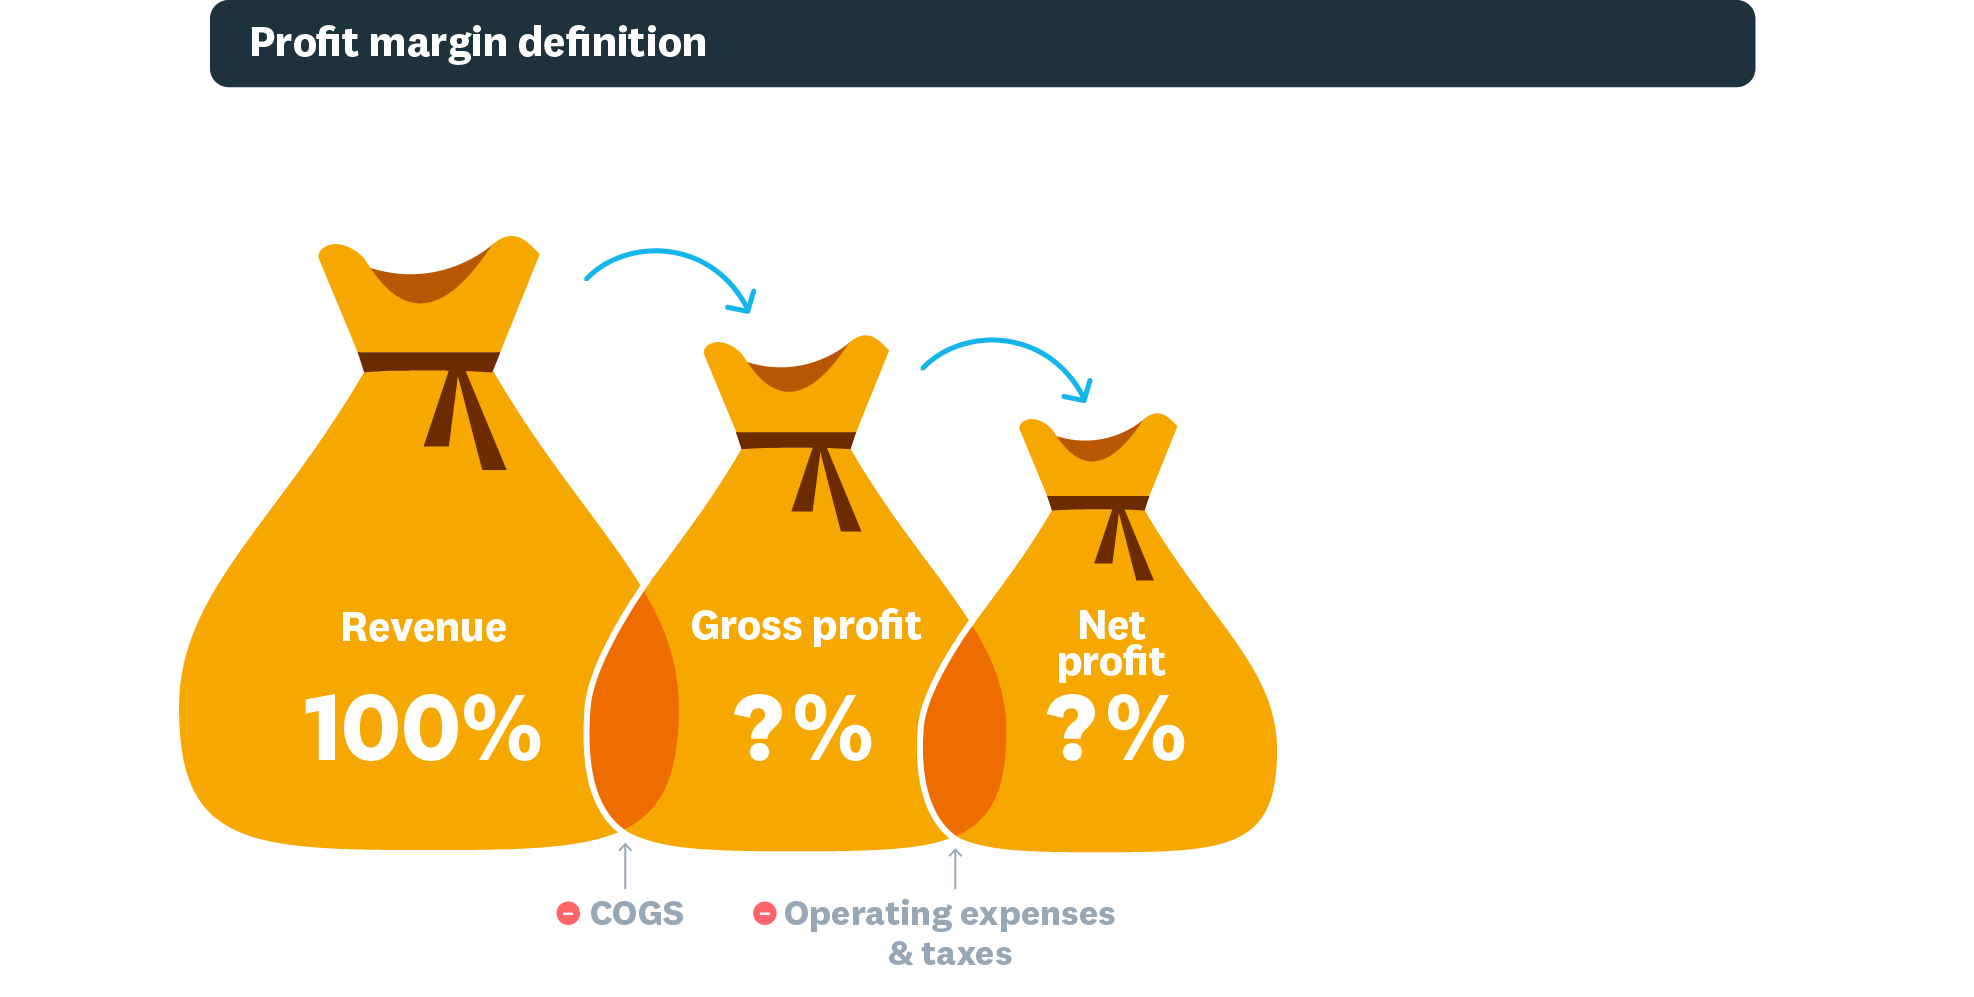
Profit margin is the percentage of revenue remaining after you subtract business expenses. This metric shows how much profit your business earns for every dollar of sales.
A healthy profit margin signals that your business can cover its costs and generate returns. Use a net profit margin calculation to see the full picture, and track your margins to understand where your business stands financially.
Profit margins let you:
- see whether your revenue covers all expenses
- identify which products, services, or areas generate the most profit
- pinpoint where cutting costs will have the greatest impact
To put these benefits in context, it helps to understand how profit margin relates to net profit.
Profit margins vs. net profit
Net profit and profit margin are related but measure different things. Net profit is the dollar amount left after paying all expenses. Profit margin converts that dollar amount into a percentage of total revenue.
Say your business earns $100,000 in revenue and has $20,000 left after expenses. Your net profit is $20,000, and your profit margin is 20%. The percentage makes it easier to compare performance across time periods or against competitors.
Profit margin formula
The profit margin formula is a straightforward way to measure your business’s profitability. It shows how much profit you keep for every dollar of revenue.
Each version of the formula divides a profit figure by revenue, then multiplies by 100 to give a percentage. Here are the three formulas written out in full.
Gross profit margin = (revenue − cost of goods sold) ÷ revenue × 100
Operating profit margin = (revenue − cost of goods sold − operating expenses) ÷ revenue × 100
Net profit margin = (revenue − all expenses, including interest and taxes) ÷ revenue × 100
Each part of these formulas has a specific meaning. Use the same definitions every time so your margins stay comparable.
- Revenue is the total money your business earns from sales before any costs come out
- Cost of goods sold (COGS) is the direct cost of making or delivering what you sell, such as materials and direct labor
- Gross profit is revenue minus cost of goods sold
- Operating expenses are the day-to-day costs of running your business, such as rent, salaries, and utilities
- Operating profit is gross profit minus operating expenses
- Net profit is gross profit minus all other operating expenses, interest, and taxes, and accountants also call it net income
The result tells you how many cents of profit you earn per dollar of sales. A 25% net profit margin means you keep $0.25 from every dollar after covering all costs.
Types of profit margins
The three main profit margin types measure different layers of your business’s profitability. All three are profitability ratios, and each one strips away a different set of costs so you can see exactly where money is going.
Gross profit margin
Gross profit margin measures profitability after direct costs only. It tells you how much revenue remains after paying for the goods or services you sell.
- Calculate it with (revenue − cost of goods sold) ÷ revenue × 100
- Use it to set prices and identify production inefficiencies
- Watch for a declining trend, which may signal rising supplier costs or underpricing
Operating profit margin goes a level deeper by factoring in your day-to-day running costs.
Operating profit margin
Operating profit margin measures your core business profitability. It accounts for operating expenses like rent, salaries, and utilities on top of direct costs.
- Calculate it with (revenue − cost of goods sold − operating expenses) ÷ revenue × 100
- Use it to evaluate how efficiently you run day-to-day operations
- Share it with banks and investors, who often review this margin before approving funding
Net profit margin captures everything, giving you the most complete view of profitability.
Net profit margin
Net profit margin measures overall profitability after every expense, including taxes, interest, and one-time costs. It gives you the complete picture of your financial performance.
- Calculate it with (revenue − all expenses, including interest and taxes) ÷ revenue × 100
- Use it to assess total financial health and long-term sustainability
- Think of it as the “bottom line” number that shows your true earnings
Learn more about net profit margin and how it applies to your business.
How to calculate profit margins
Calculating profit margins follows the same core steps for every margin type. Once you know which profit figure you need, the math takes seconds.
Follow these steps for a gross, operating, or net margin.
- Find the profit figure for the margin you want: gross profit, operating profit, or net profit
- Divide that profit figure by total revenue for the same period
- Multiply the result by 100 to turn it into a percentage
The three examples below put these steps to work with real dollar amounts. The first is a service business with low direct costs.
Service business: a cleaning company
Say your business earns $20,000 cleaning offices, and it costs $8,000 to deliver those services. Your gross profit is $20,000 − $8,000 = $12,000. Your gross profit margin is $12,000 ÷ $20,000 × 100 = 60%.
Next, subtract $3,000 in rent, utilities, and administrative costs to get $9,000 in operating profit. Your operating profit margin is $9,000 ÷ $20,000 × 100 = 45%. This tells you how efficiently your business runs before taxes and interest.
Finally, subtract $4,000 in taxes and interest to reach $5,000 in net profit. Your net profit margin is $5,000 ÷ $20,000 × 100 = 25%.
A product business follows the same steps, with the cost of its stock counted in cost of goods sold.
Product business: a retail gift shop
Picture a gift shop with $150,000 in revenue and $90,000 in cost of goods sold. Its gross profit is $150,000 − $90,000 = $60,000. The gross profit margin is $60,000 ÷ $150,000 × 100 = 40%.
The shop spends $36,000 on operating expenses such as rent, staff, and marketing, which leaves $24,000 in operating profit. That’s an operating profit margin of $24,000 ÷ $150,000 × 100 = 16%.
After $6,000 in interest and taxes, net profit is $18,000. The net profit margin is $18,000 ÷ $150,000 × 100 = 12%, above the 2–6% range for general retail shown in the benchmarks below.
The margin shrinks at each layer, from 40% gross to 16% operating. That drop shows running costs take the biggest share of this shop’s gross profit.
You can also run the formula in reverse when you know the margin you want and need to set a price.
Reverse calculation: pricing for a 20% margin
Say you’re a freelance consultant who wants a 20% net profit margin on a project with $5,000 in expected costs. To find the price, divide your costs by one minus your target margin.
Price = costs ÷ (1 − target margin)
For this project, $5,000 ÷ (1 − 0.20) = $5,000 ÷ 0.80 = $6,250. To check it, $6,250 − $5,000 = $1,250 in profit, and $1,250 ÷ $6,250 × 100 = 20%.
Adding 20% to your costs instead gives a $6,000 price and $1,000 in profit. That’s a 16.7% margin, short of your 20% target.
Accounting software like Xero connects your financial data in one place. You can run customizable reports and view your gross, operating, and net margins without building spreadsheets manually.
Profit margin vs. markup
Profit margin and markup both measure profitability, but they use different base numbers. Mixing them up is an easy pricing mistake to make.
Profit margin divides profit by revenue (the selling price). Markup divides profit by cost (what you paid for the item). The same dollar profit produces a different percentage depending on which base you use.
Looking at the formulas side by side makes this clearer.
Formula comparison
Both formulas start with the same profit amount but produce different percentages.
Profit margin = (selling price − cost) ÷ selling price × 100
Markup = (selling price − cost) ÷ cost × 100
Notice that margin uses the selling price as the denominator, while markup uses the cost.
A real-numbers example shows just how different the results can be.
Worked example
Say you buy a product for $60 and sell it for $100. Your profit is $40.
The profit margin is $40 ÷ $100 × 100 = 40%.
The markup is $40 ÷ $60 × 100 = 66.7%.
The same $40 profit gives you a 40% margin but a 66.7% markup. Markup is always a higher number than margin for the same transaction.
Getting this distinction right is critical when setting your prices.
Why it matters for pricing
Confusing the two affects your earnings. Apply a 50% markup when you meant a 50% margin, and you’ll fall short.
A 50% markup on a $60 item sets the price at $90. To achieve a 50% margin, you need to price at $120. That gap adds up quickly across hundreds of sales.
When setting prices, be clear about whether you’re working with margin or markup. Use margin when you want to know what portion of revenue becomes profit. Use markup when you want to know how much to add on top of your costs.
What is a good profit margin?
A 10% net profit margin is generally considered healthy, 20% or higher signals strong performance, and 5% is on the low side. A good profit margin depends heavily on your industry and business model. Comparing your numbers to the right benchmark matters more than chasing a single target.
Typical ranges by margin type give you a starting point.
- Gross margin of 20–80%, depending on industry
- Operating margin of 5–20% for financially healthy businesses
- Net margin of 5–15%, which generally indicates solid performance
To make these ranges actionable, compare your margins to specific industry benchmarks.
Industry profit margin benchmarks
Profit margins vary widely from one industry to the next, so knowing where your sector typically falls helps you set realistic targets. These are average net profit margin ranges based on US industry data.
Service-based industries generally earn higher margins because they carry lower direct costs.
- Accounting and bookkeeping services at 15–20%
- Consulting and professional services at 10–20%
- Financial services and insurance at 15–25%
- Healthcare services at 10–15%
- Legal services at 15–25%
- Software and technology at 15–25%
Product-based and physical industries typically operate on thinner margins due to inventory, shipping, and labor costs.
- Auto repair and maintenance at 10–15%
- Construction at 5–10%
- E-commerce and online retail at 5–10%
- Manufacturing at 5–10%
- Real estate services at 10–15%
- Restaurants and food service at 3–9%
- Retail (general) at 2–6%
Compare your margins to businesses in your specific sector for the most useful benchmark.
What profit margin trends reveal
Tracking your margins over time shows whether your financial health is improving or slipping. A steady increase signals growing efficiency and stronger pricing. A declining trend may point to rising costs, pricing pressure, or operational issues that need attention.
For example, a bakery might see its gross margin drop from 65% to 55% over six months. That trend could reveal rising ingredient costs that need renegotiating with suppliers. Tracking the trend helps the owner act before cash flow becomes tight.
Compare your margin trends against competitors and industry averages. This context helps you tell whether a dip is an industry-wide shift or something specific to your business.
What is a good profit margin for a small business?
Small businesses face unique margin pressures that larger companies can absorb more easily. You may have less purchasing power to negotiate bulk discounts. Fixed costs like rent and insurance also take up a bigger share of your revenue.
As a general guideline, a net profit margin of 7–10% puts most small businesses on solid footing. If you consistently hit above 10%, you’re outperforming a large portion of small businesses. Below 5%, it becomes difficult to build a cash buffer or invest in growth.
Focus on the trend rather than a single snapshot. A small business earning a 6% margin that’s climbing steadily is often in a stronger position than one earning 12% that’s declining. Your margin of safety matters just as much as the margin itself.
Why do profit margins matter?
Profit margins reveal your business’s financial health by comparing revenue to expenses. They help you make better decisions about pricing, cost control, and budgeting. When you need funding, banks and investors review your margins before approving loans or investments.
Using profit margins to guide business decisions
Profit margin data helps you allocate resources and plan for growth. You can also use it alongside your financial statements for a fuller picture of business performance. When you know which products and services deliver the highest margins, you can focus your energy and investment there.
Here are practical ways to use your margin data.
- Direct investment toward your highest-margin products and services
- Adjust pricing on low-margin items or consider dropping them
- Identify which business areas deserve expansion
- Decide when your finances support hiring or new equipment
Understanding what drives your margins up or down is just as important as knowing the numbers.
Factors that affect profit margins
Several external and internal factors can shift your margins. Understanding these helps you respond quickly when numbers change.
Market conditions play a significant role. Inflation, shifting interest rates, and changes in trade policy can all increase your costs.
According to Xero Small Business Insights, US small business sales grew 4.0% year over year in the June quarter of 2026. That’s up from 3.5% in the March quarter and 2.1% in the December 2025 quarter, though still below the 5.4% long-term average.
The report links that gap to higher gasoline prices tied to the Middle East conflict. When your customers spend more at the pump, they have less to spend with you, and your profit margins feel the pressure.
Borrowing costs are climbing too. On September 16, 2026, the Federal Reserve raised its federal funds target range by 0.25 percentage point to 3.75%–4%, its first increase since July 2023. If your business carries debt, higher interest payments can shrink your net margin.
Your business location also matters. Rent, state taxes, and local labor costs vary widely. Include these costs when you assess your margins and set your pricing strategy.
How to increase your profit margins
Increasing your profit margins takes a mix of lower costs, better efficiency, and smarter pricing. These strategies can help you increase profits over time, and you can start using them today.
1. Control your costs
Review your expenses regularly and cut what you don’t need. Cancel unused subscriptions, renegotiate supplier contracts, and look for cost-saving opportunities. Small savings across many line items add up to meaningful margin improvements.
Manage labor costs by matching staffing levels to demand. Cross-train employees so your team can handle busy periods without overtime.
2. Improve operational efficiency
Streamline your processes to get more output from the same resources. Automate repetitive tasks like invoicing and bank reconciliation with accounting software. Invest in staff training so your team works faster and makes fewer costly mistakes.
Great customer service also drives efficiency. Happy customers come back and refer others, so retention is one of the simplest ways to protect your margins.
3. Adjust your pricing strategy
A strong pricing strategy can lift your margins without cutting a single cost. Try these approaches to earn more on each sale.
- Use dynamic pricing to adjust for demand and seasonal changes
- Create premium packages or bundles to increase revenue per customer
- Raise prices on products where you deliver clear, differentiated value
Pricing adjustments work best when your product mix supports them.
4. Focus on high-margin products and services
Some products and services contribute far more to your bottom line than others. Review your margins by product line and shift your focus toward the items that generate the highest returns.
Consider reducing your investment in consistently low-margin offerings. If a product barely breaks even after all costs, your time and resources may be better spent elsewhere.
5. Build customer loyalty
Loyal customers spend more, buy more often, and cost less to serve. Communicate your value clearly so customers understand what sets you apart. Deliver consistent quality and excellent service to keep them coming back.
Loyalty programs and referral incentives can strengthen these relationships while driving repeat revenue.
Track your profit margins with Xero
Understanding your profit margins gives you the clarity to price your products, control costs, and invest in the right areas. When you track your margins consistently, you catch problems early and spot opportunities sooner.
Xero brings your accounting data into easy-to-read, customizable reports, so you can monitor gross, operating, and net margins in real time. Automated bank feeds keep those numbers current with less manual work. Sign up today and get one month free.
FAQs on profit margins
Here are answers to common questions about profit margins and how to use them in your business.
How do you calculate profit margin?
Divide net profit by total revenue, then multiply by 100. Take both figures from the same profit and loss statement, such as a monthly or quarterly report, so they cover the same period.
What does a 30% profit margin mean?
A 30% profit margin means you keep $0.30 as profit for every dollar of revenue after paying all expenses. The remaining $0.70 covers your business costs, including materials, labor, rent, and taxes.
How do I calculate a 20% profit margin?
A 20% margin is the same as a 25% markup, so multiply your costs by 1.25 to set your price. For example, $800 in costs × 1.25 = a $1,000 price, leaving $200 in profit, which is 20% of $1,000.
What is the difference between profit margin and markup?
Margin measures profit against the selling price, while markup measures it against cost. To convert a markup into a margin, divide it by 1 plus the markup: 0.50 ÷ 1.50 turns a 50% markup into a 33.3% margin.
Why is my profit margin decreasing?
Falling margins usually come from rising costs, pricing pressure, or both. Compare your cost of goods sold and overheads line by line against the same period last year to find which costs grew faster than revenue.
Can a profit margin be negative?
Yes, a margin turns negative when expenses are higher than revenue for the period. For example, $12,000 in costs on $10,000 in revenue gives a −20% margin, a signal to review pricing and costs quickly.
Disclaimer
Xero does not provide accounting, tax, business or legal advice. This guide has been provided for information purposes only. You should consult your own professional advisors for advice directly relating to your business or before taking action in relation to any of the content provided.