United States Small Business Insights
This analysis focuses on several core performance metrics, including sales growth, time to be paid, and late payments.


US small businesses see improved performance
Published: February 6, 2025
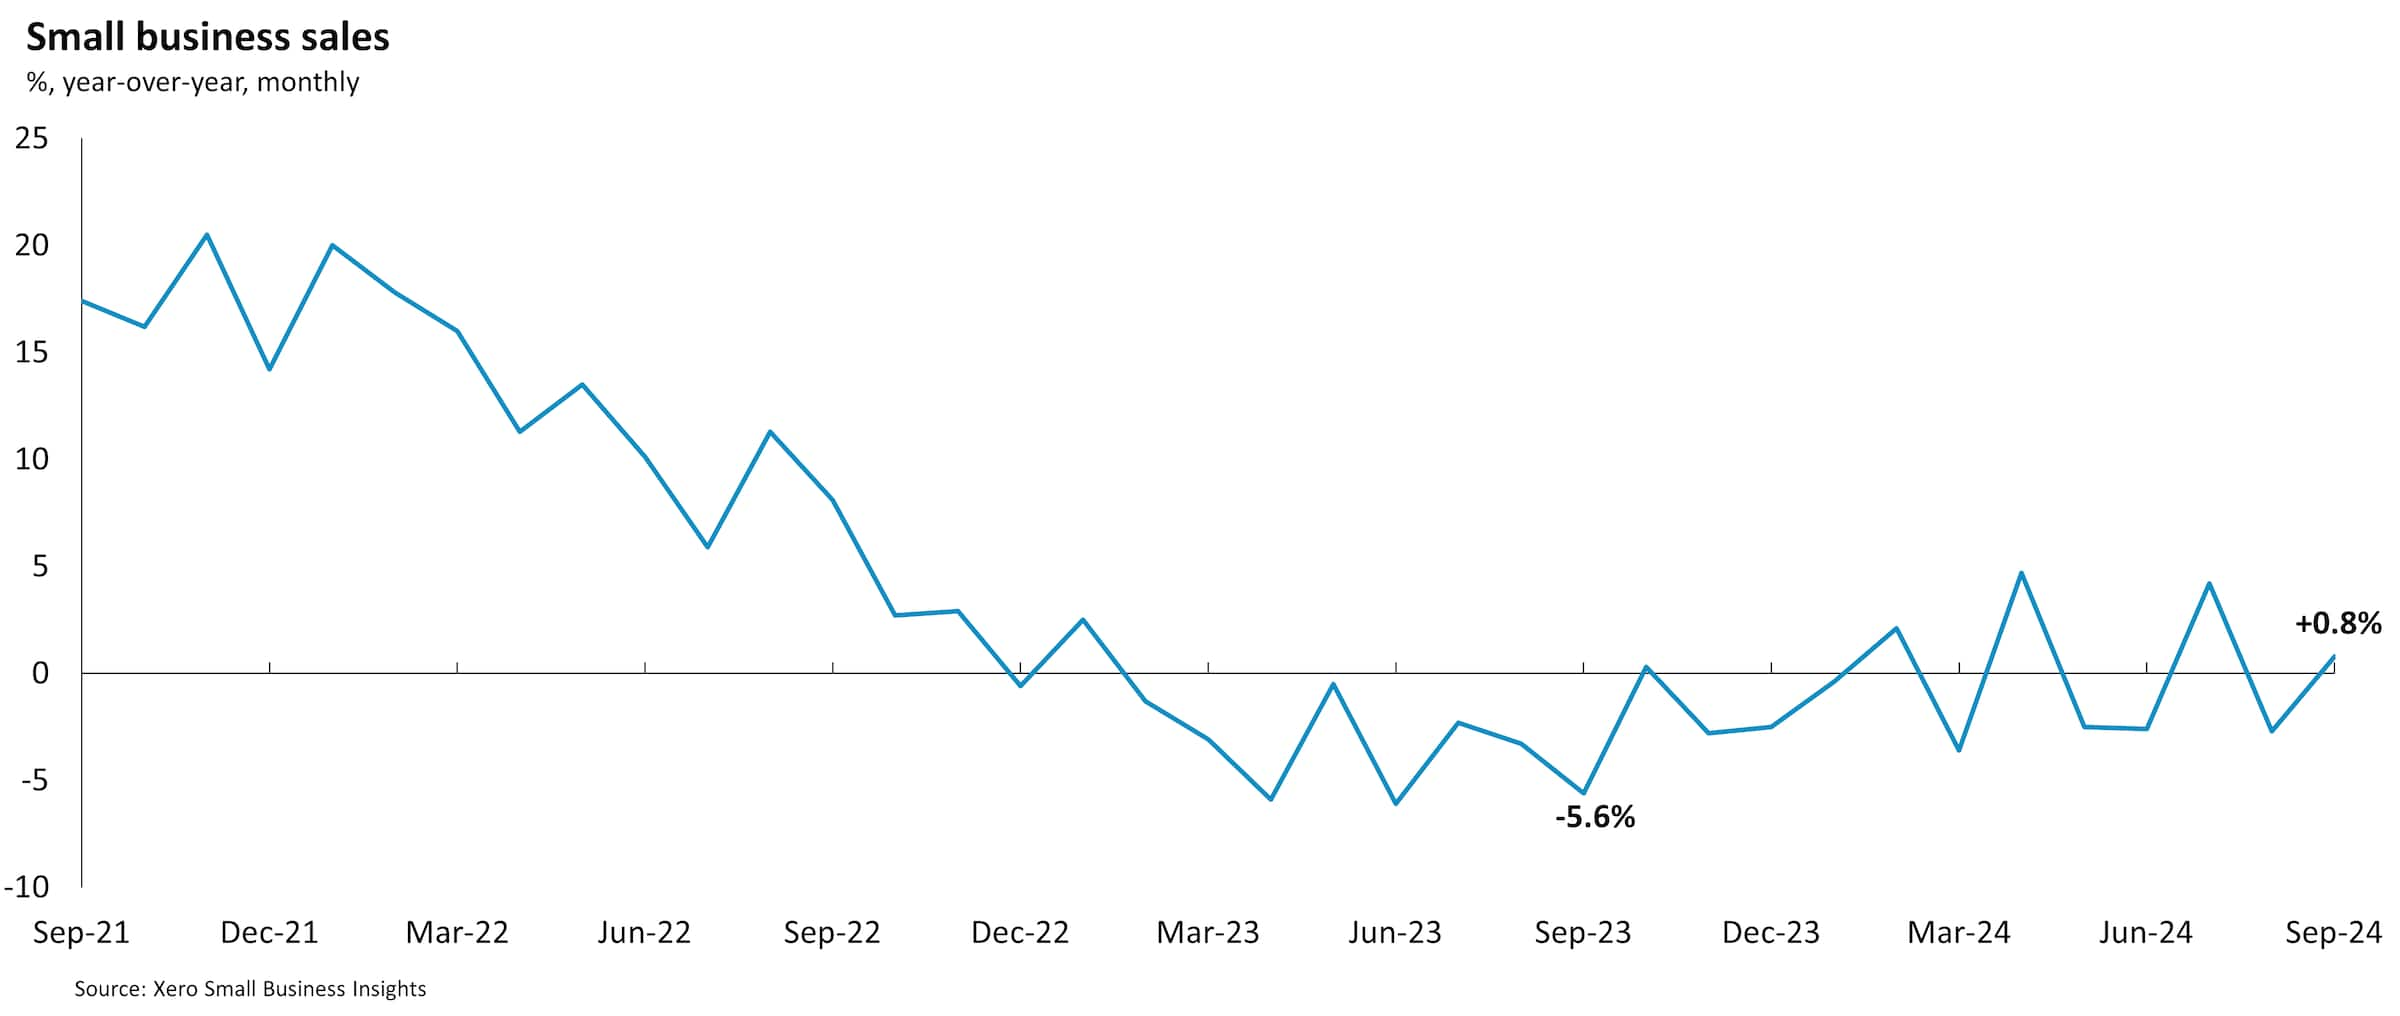
The latest Xero Small Business Insights (XSBI) data for the US shows overall performance improved for small businesses in the September quarter. Sales growth was positive for the first time in almost two years and both payments metrics had shorter waiting times.
Sales grow for first quarter in almost two years
Small business sales rose an average of 0.8% year-over-year (y/y) in the three months to September, following a 0.1% fall in the June quarter (revised up from the 0.9% y/y decline initially reported). While only a very small sales increase, it’s worth celebrating as the first positive quarterly sales growth since the December quarter 2022. The monthly breakdown over the quarter was a 4.2% y/y rise in July, a 2.7% y/y fall in August and a 0.8% y/y rise in September.

Sales volumes (which removes the effect of price changes from the XSBI series so that we can measure changes in how many goods and services have been sold) have been weaker than the nominal-based XSBI series. Using the US CPI as a proxy for prices, sales volumes fell 1.8% y/y in the September quarter. This means US small businesses still sold fewer units of goods and services than in September 2023.
Both payment times metrics show improvement
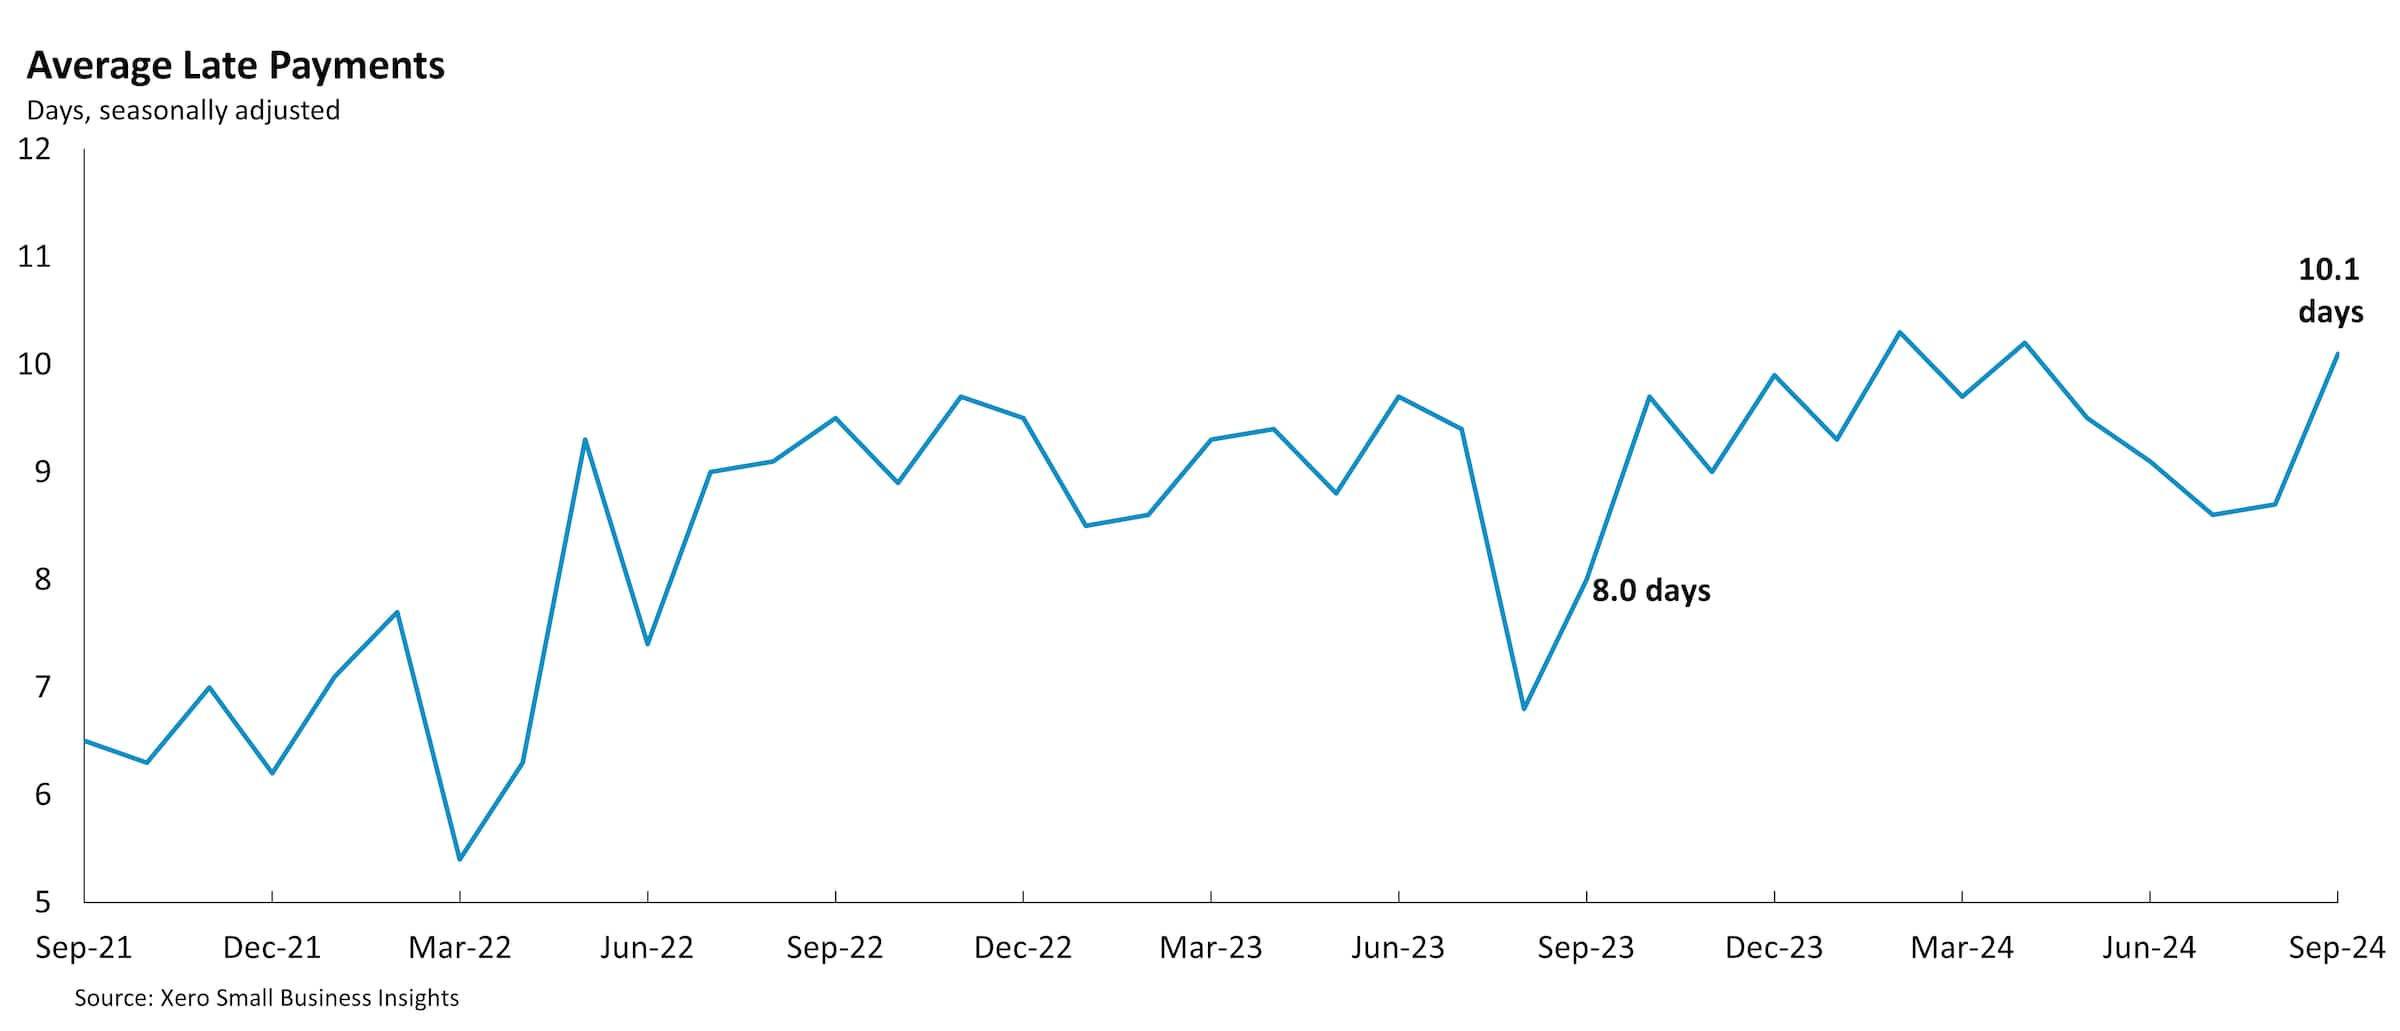
Late payment times improved during the September quarter. Small businesses were paid an average of 9.1 days late in the September quarter. This is 0.5 days shorter than the June quarter result. The improving trend, that has been underway since April 2024, would have been even more pronounced if it were not for the month of September result, when small businesses were paid on average 10.1 days late.

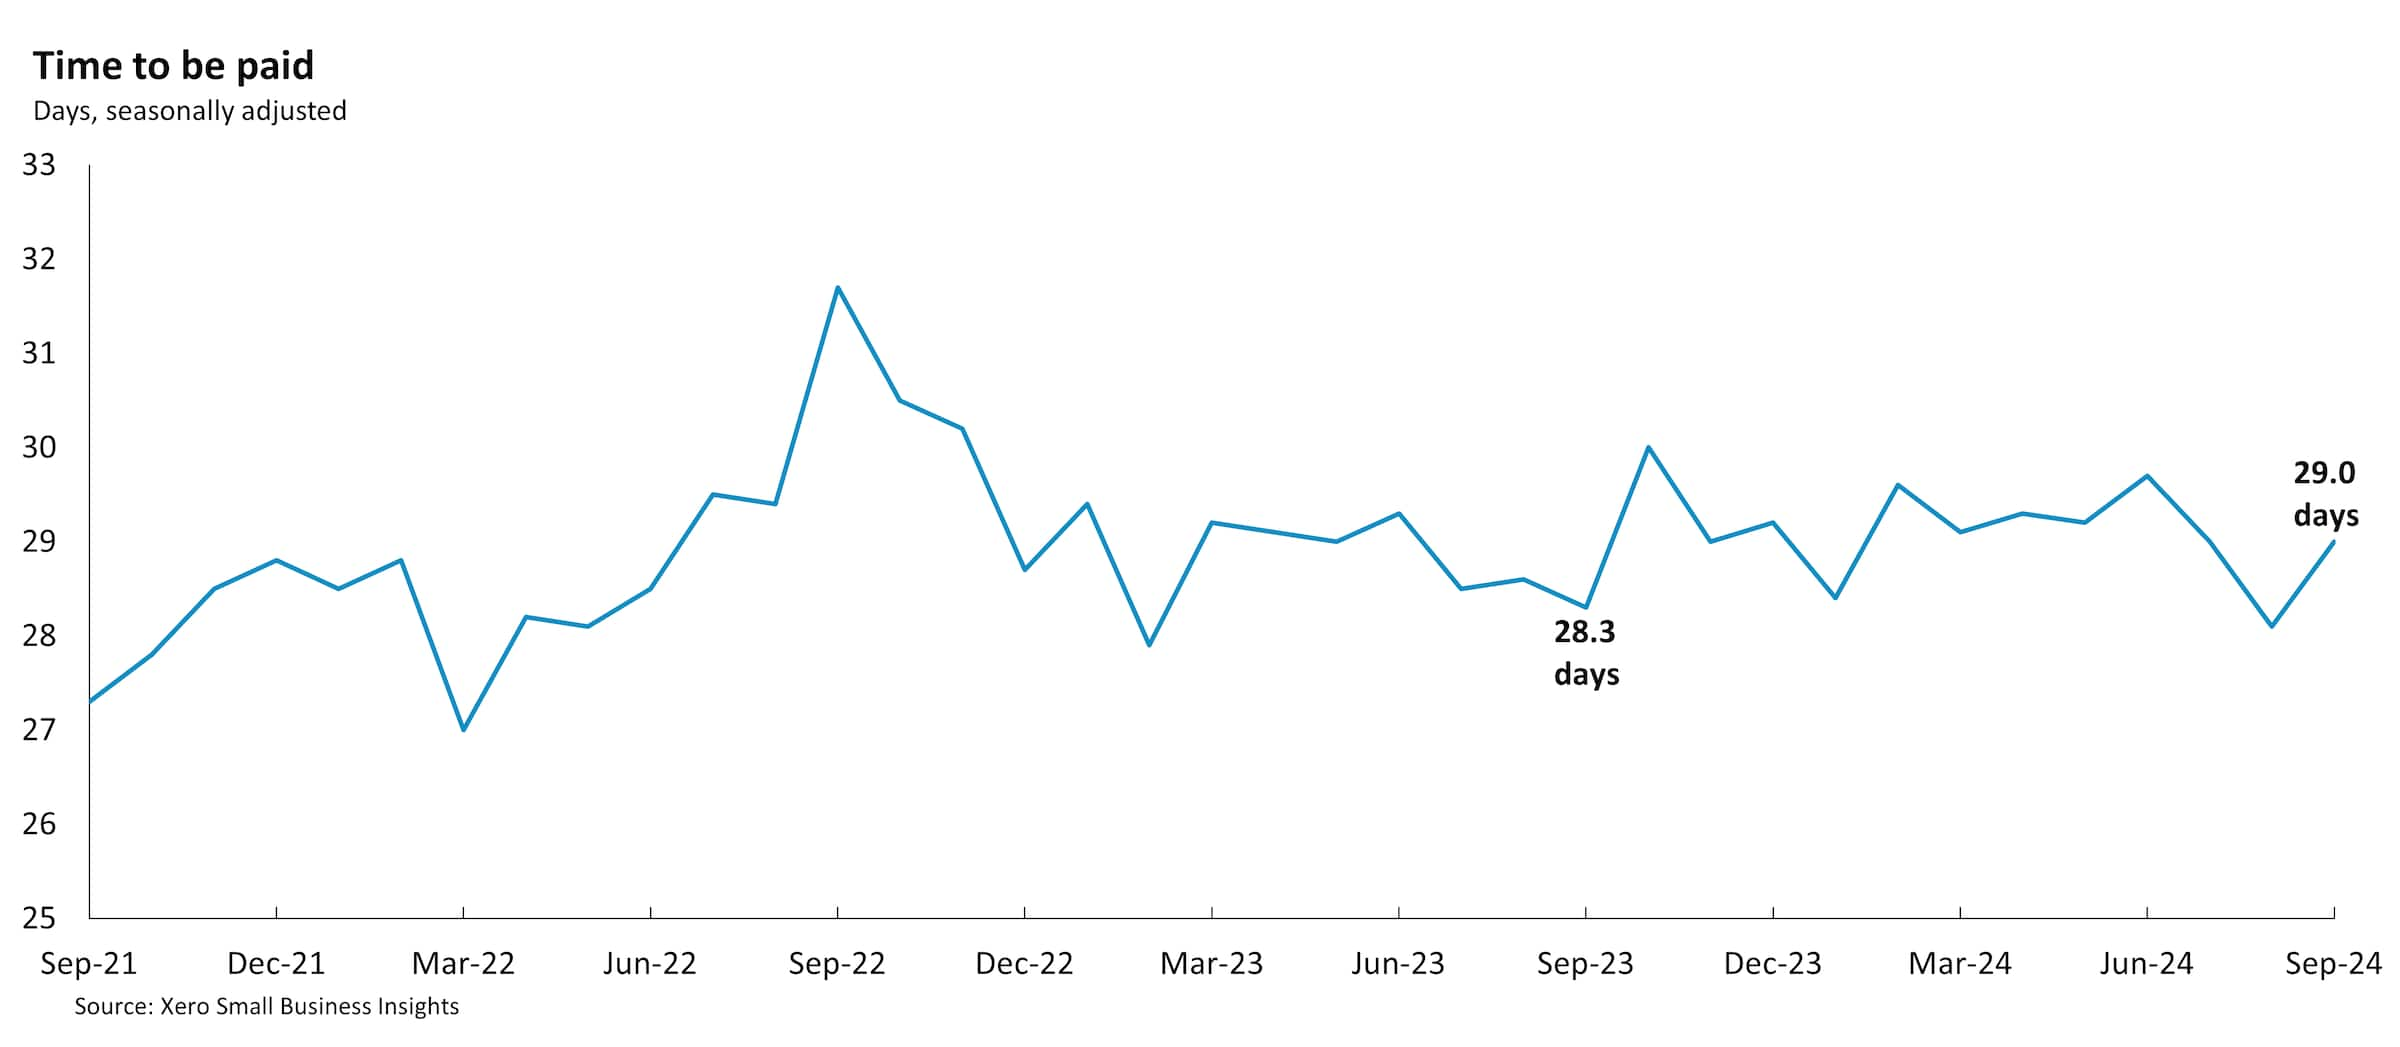
Small businesses waited an average of 28.7 days to be paid in the September quarter, 0.7 days shorter than the June quarter. This metric has been generally stable, between 28.5 days and 29.5 days, since early 2023.

Regional sales results led by Northeast
Looking at the regional results, all major regions recorded positive sales growth in the September quarter. This was led by the Northeast (+1.3% y/y), followed by West (+0.8% y/y), South (+0.6% y/y) and Midwest (+0.2% y/y). The most consistent region over 2024 so far has been the West, which has now recorded three consecutive quarters of sales growth. The average time small businesses waited to be paid in the major regions was more mixed. Two regions showed an improvement - South (down 1.8 days to 28.5 days) and the Midwest (down 0.3 days to 30.0 days). Meanwhile, two regions had longer payment times - Northeast (up 1.3 days to 29.0 days) and West (up 0.5 days to 28.2 days).
88% of US respondents said they were either still positive, more positive or much more positive about the future of their business than they were in the previous month
Xero survey of US small businesses (November 2024)¹
What are the prospects for US small businesses as we head into 2025?
There are signs that most US small businesses are feeling positive as they end 2024 and get ready for 2025. In a Xero survey of small businesses in November¹ 88% of US respondents said they were either still positive, more positive or much more positive about the future of their business than they were in the previous month.¹ This was the highest result of all countries included in this survey (Australia, Canada, New Zealand, UK). A key driver of this sentiment improvement is likely to be the lower inflation and interest rate environment that the US is now experiencing, compared to earlier in 2024. The Federal Reserve has cut its Federal Funds target range to 4.25% to 4.5% and financial markets are still pricing in further rate cuts this year.
The US government's decision to levy tariffs on Canadian goods, and the subsequent retaliatory measures, have likely dented this growing optimism. Small businesses and their customers on both sides of the Canadian-US border will pay more for cross-border goods, impacting the often intertwined supply chains and increasing the cost of business operations. We cover more about what US small business owners and their advisors should be looking out for on the Xero Blog.
For more information on the XSBI metrics, see our methodology page.
¹ This was an online survey commissioned by Xero in November 2024. Responses are among small businesses in Australia (300), Canada (250), New Zealand (154), UK (600) and US (290) during November 2024. Options have been edited for readability.
Disclaimer
This report was prepared using Xero Small Business Insights data and publicly available data for the purpose of informing and developing policies to support small businesses.
This report includes and is in parts based on assumptions or estimates. It contains general information only and should not be taken as taxation, financial, investment or legal advice. Xero recommends that readers always obtain specific and detailed professional advice about any business decision.
The insights in this report were created from the data that was available as at the date it was extracted. Data used was anonymised and aggregated to ensure individual businesses can not be identified.
Contact us about Xero Small Business Insights
Arming small business owners with simple but powerful insights. If you have any questions, reach out to us.