Take control with Xero business performance software
Hit your business goals with Xero’s advanced performance management system for your small business. Choose what to display on your dashboard so you know exactly what’s happening with your numbers. Then use Xero’s customizable reports for deeper insights and better business decisions.
The vision to grow your business
With a clear view of your numbers, you can spot opportunities to improve and expand when using Xero to track your business performance.
Track your chosen metrics
Your dashboard displays metrics like cash flow and sales, so you can quickly see how your business is doing.
Get detailed insights
Xero business performance management software crunches your numbers to help you digest them.
Make better decisions
Understanding your business’s strengths and weaknesses lets you plan your next steps with confidence.
I’m not an accountant, but I do like looking at numbers and dashboards that enable us to see quickly how our business is doing.
Sheryl Ozinsky, Oranjezicht City Farm Market

Track your chosen metrics
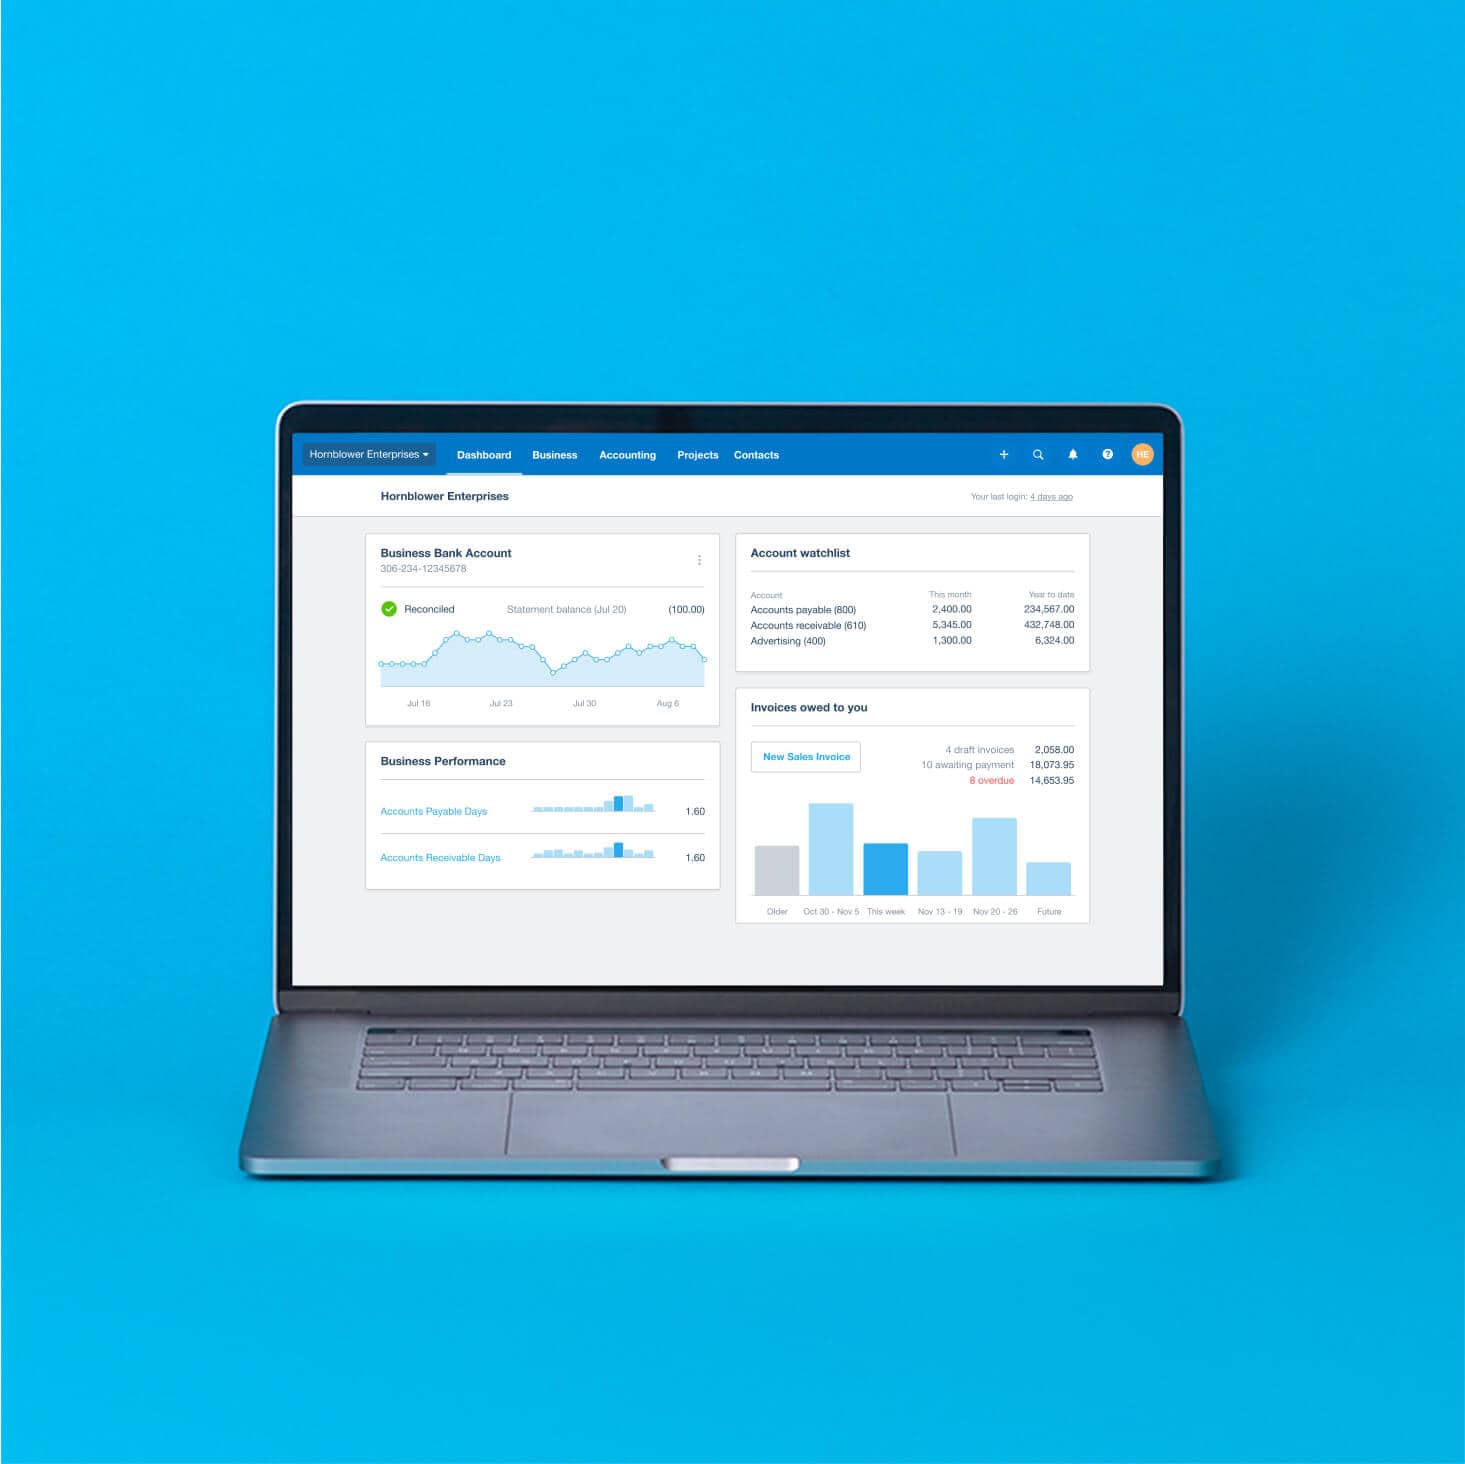
Want to keep an eye on your gross profit? Or track your debt to equity with full accuracy? Organize your Xero dashboard to show the metrics that matter most to your business, in your preferred order. These charts and graphs help you understand your business performance at a glance.
- Watch metrics like bills you need to pay, and total cash in and out of your business
- Check all your bank balances in one place – no more switching between web pages
- Follow the dashboard on your mobile device to stay productive on the go
Get clear, detailed insights
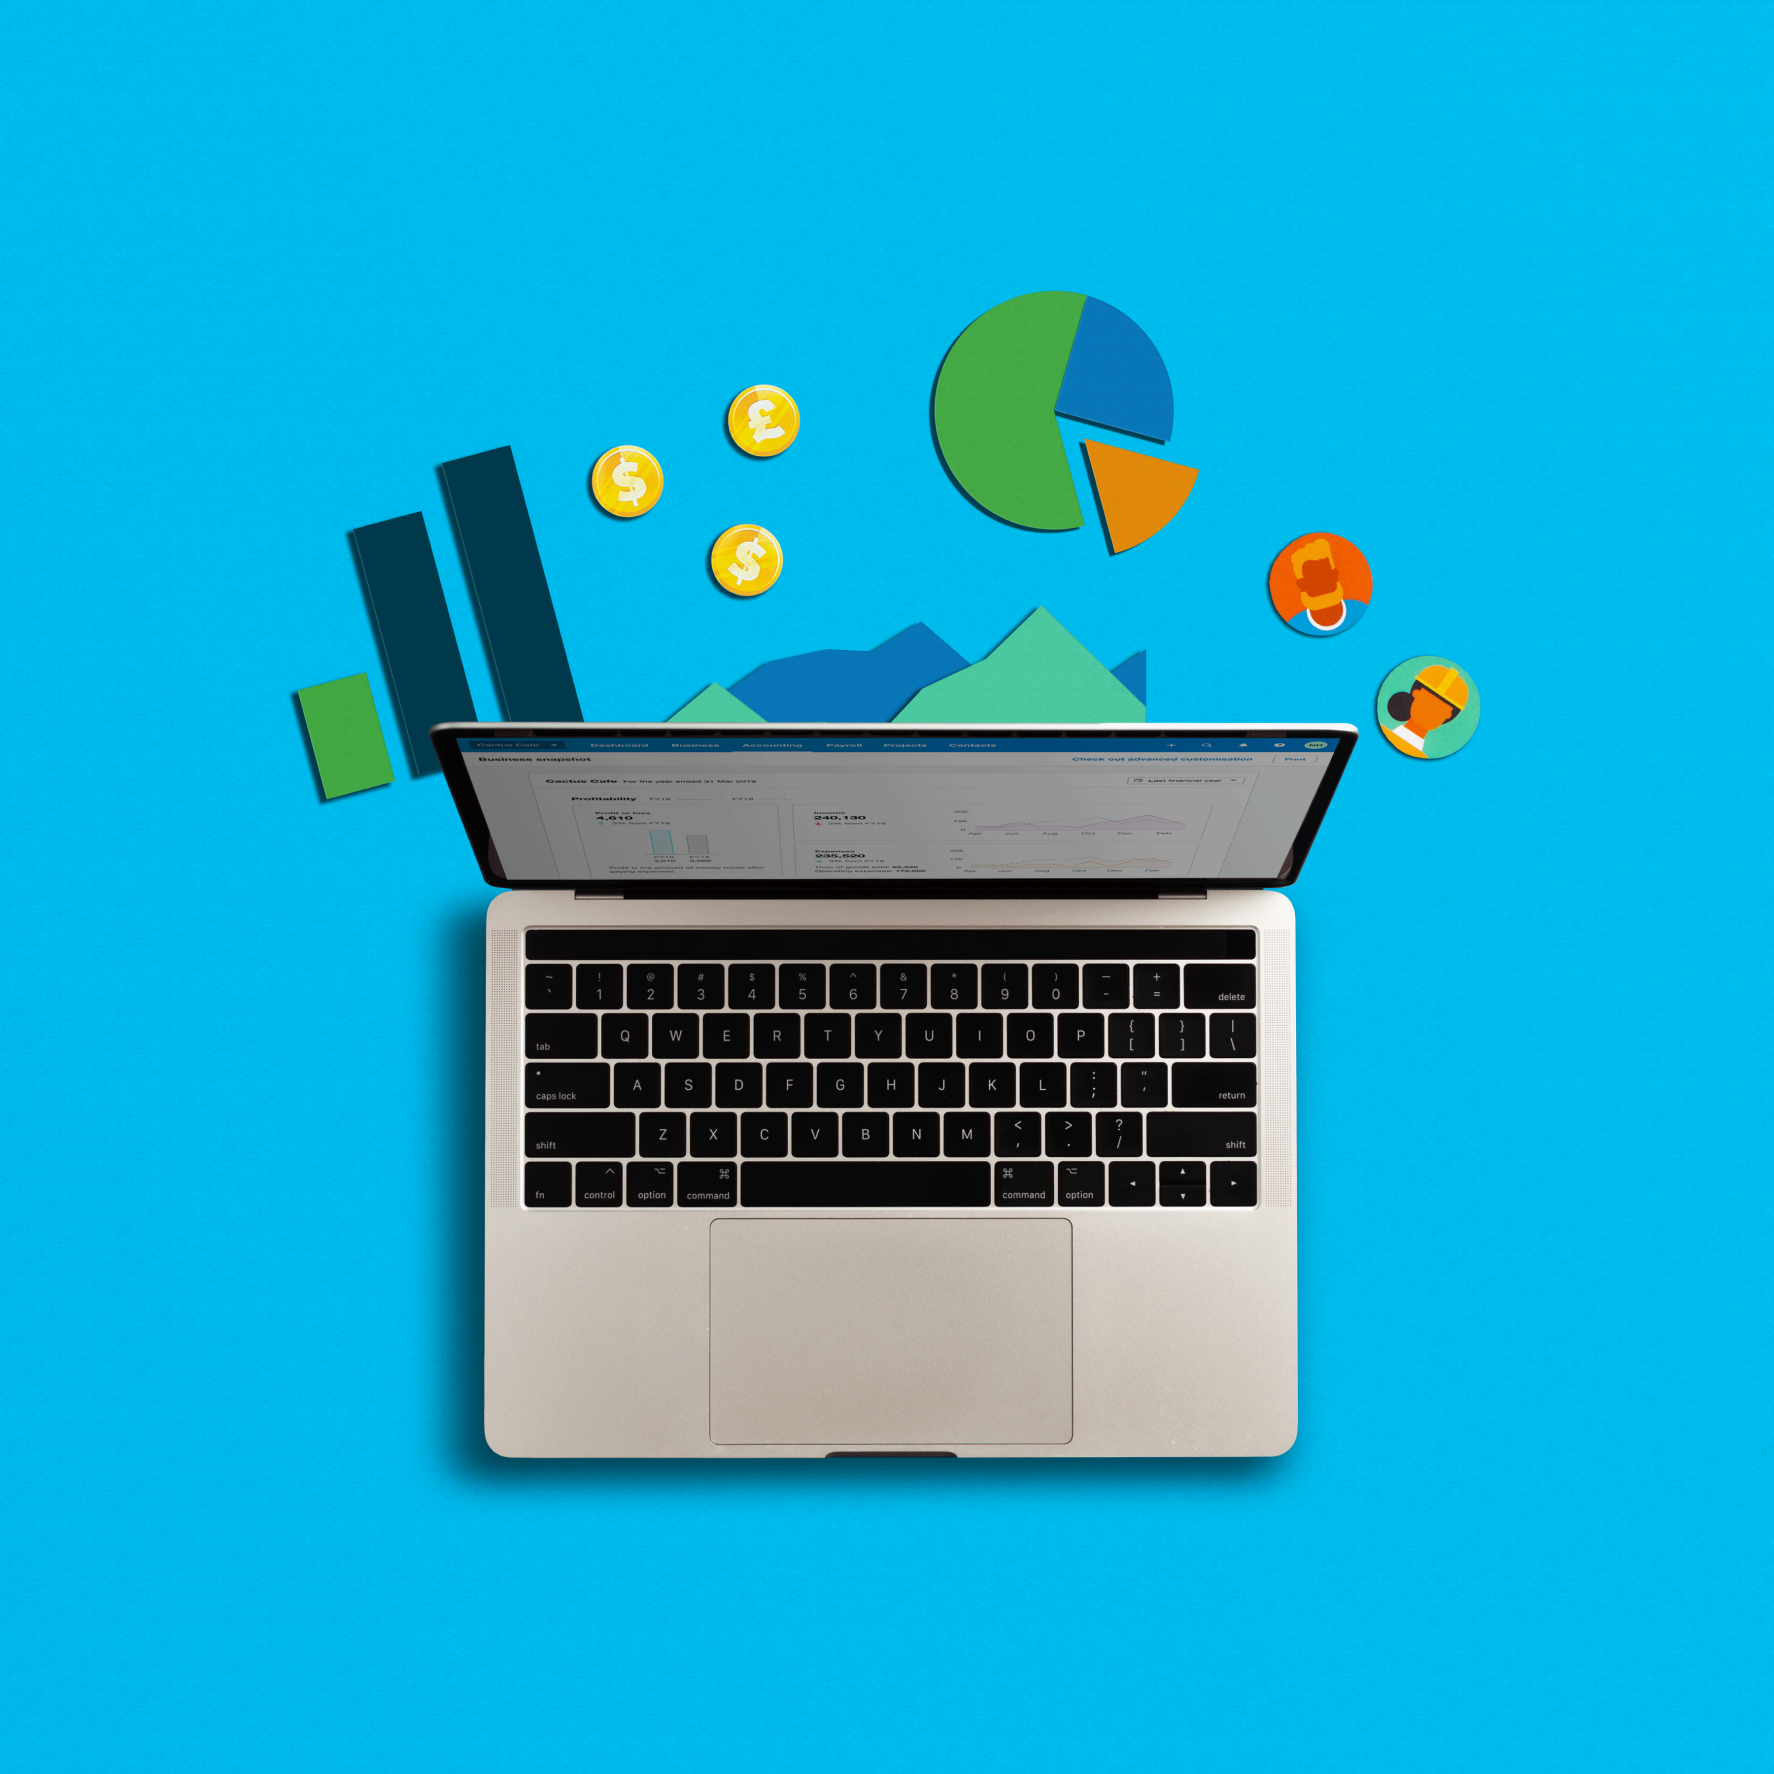
Xero performance management software helps you make sense of your data, whether it’s spotting your best month for cash flow, or comparing your profits over the past few years. Zoom into the specifics with detailed info that’s always up to date and expressed with sparkling clarity.
- Learn from tools like reports, short-term cash flow projections, and analytics
- See information as colorful graphs and data visualisations
- Understand metrics and calculations without the jargon
Make better decisions
Maybe you see cash flow problems ahead. Or perhaps your inventory planning could use some work. Xero empowers you to make better decisions by putting the right information at your fingertips and helping you collaborate more easily with your accountant or bookkeeper.
- Set and track your business performance goals, such as boosting your sales revenue
- Strengthen your financial planning – for example, confidently decide when to pay your bills or take on staff
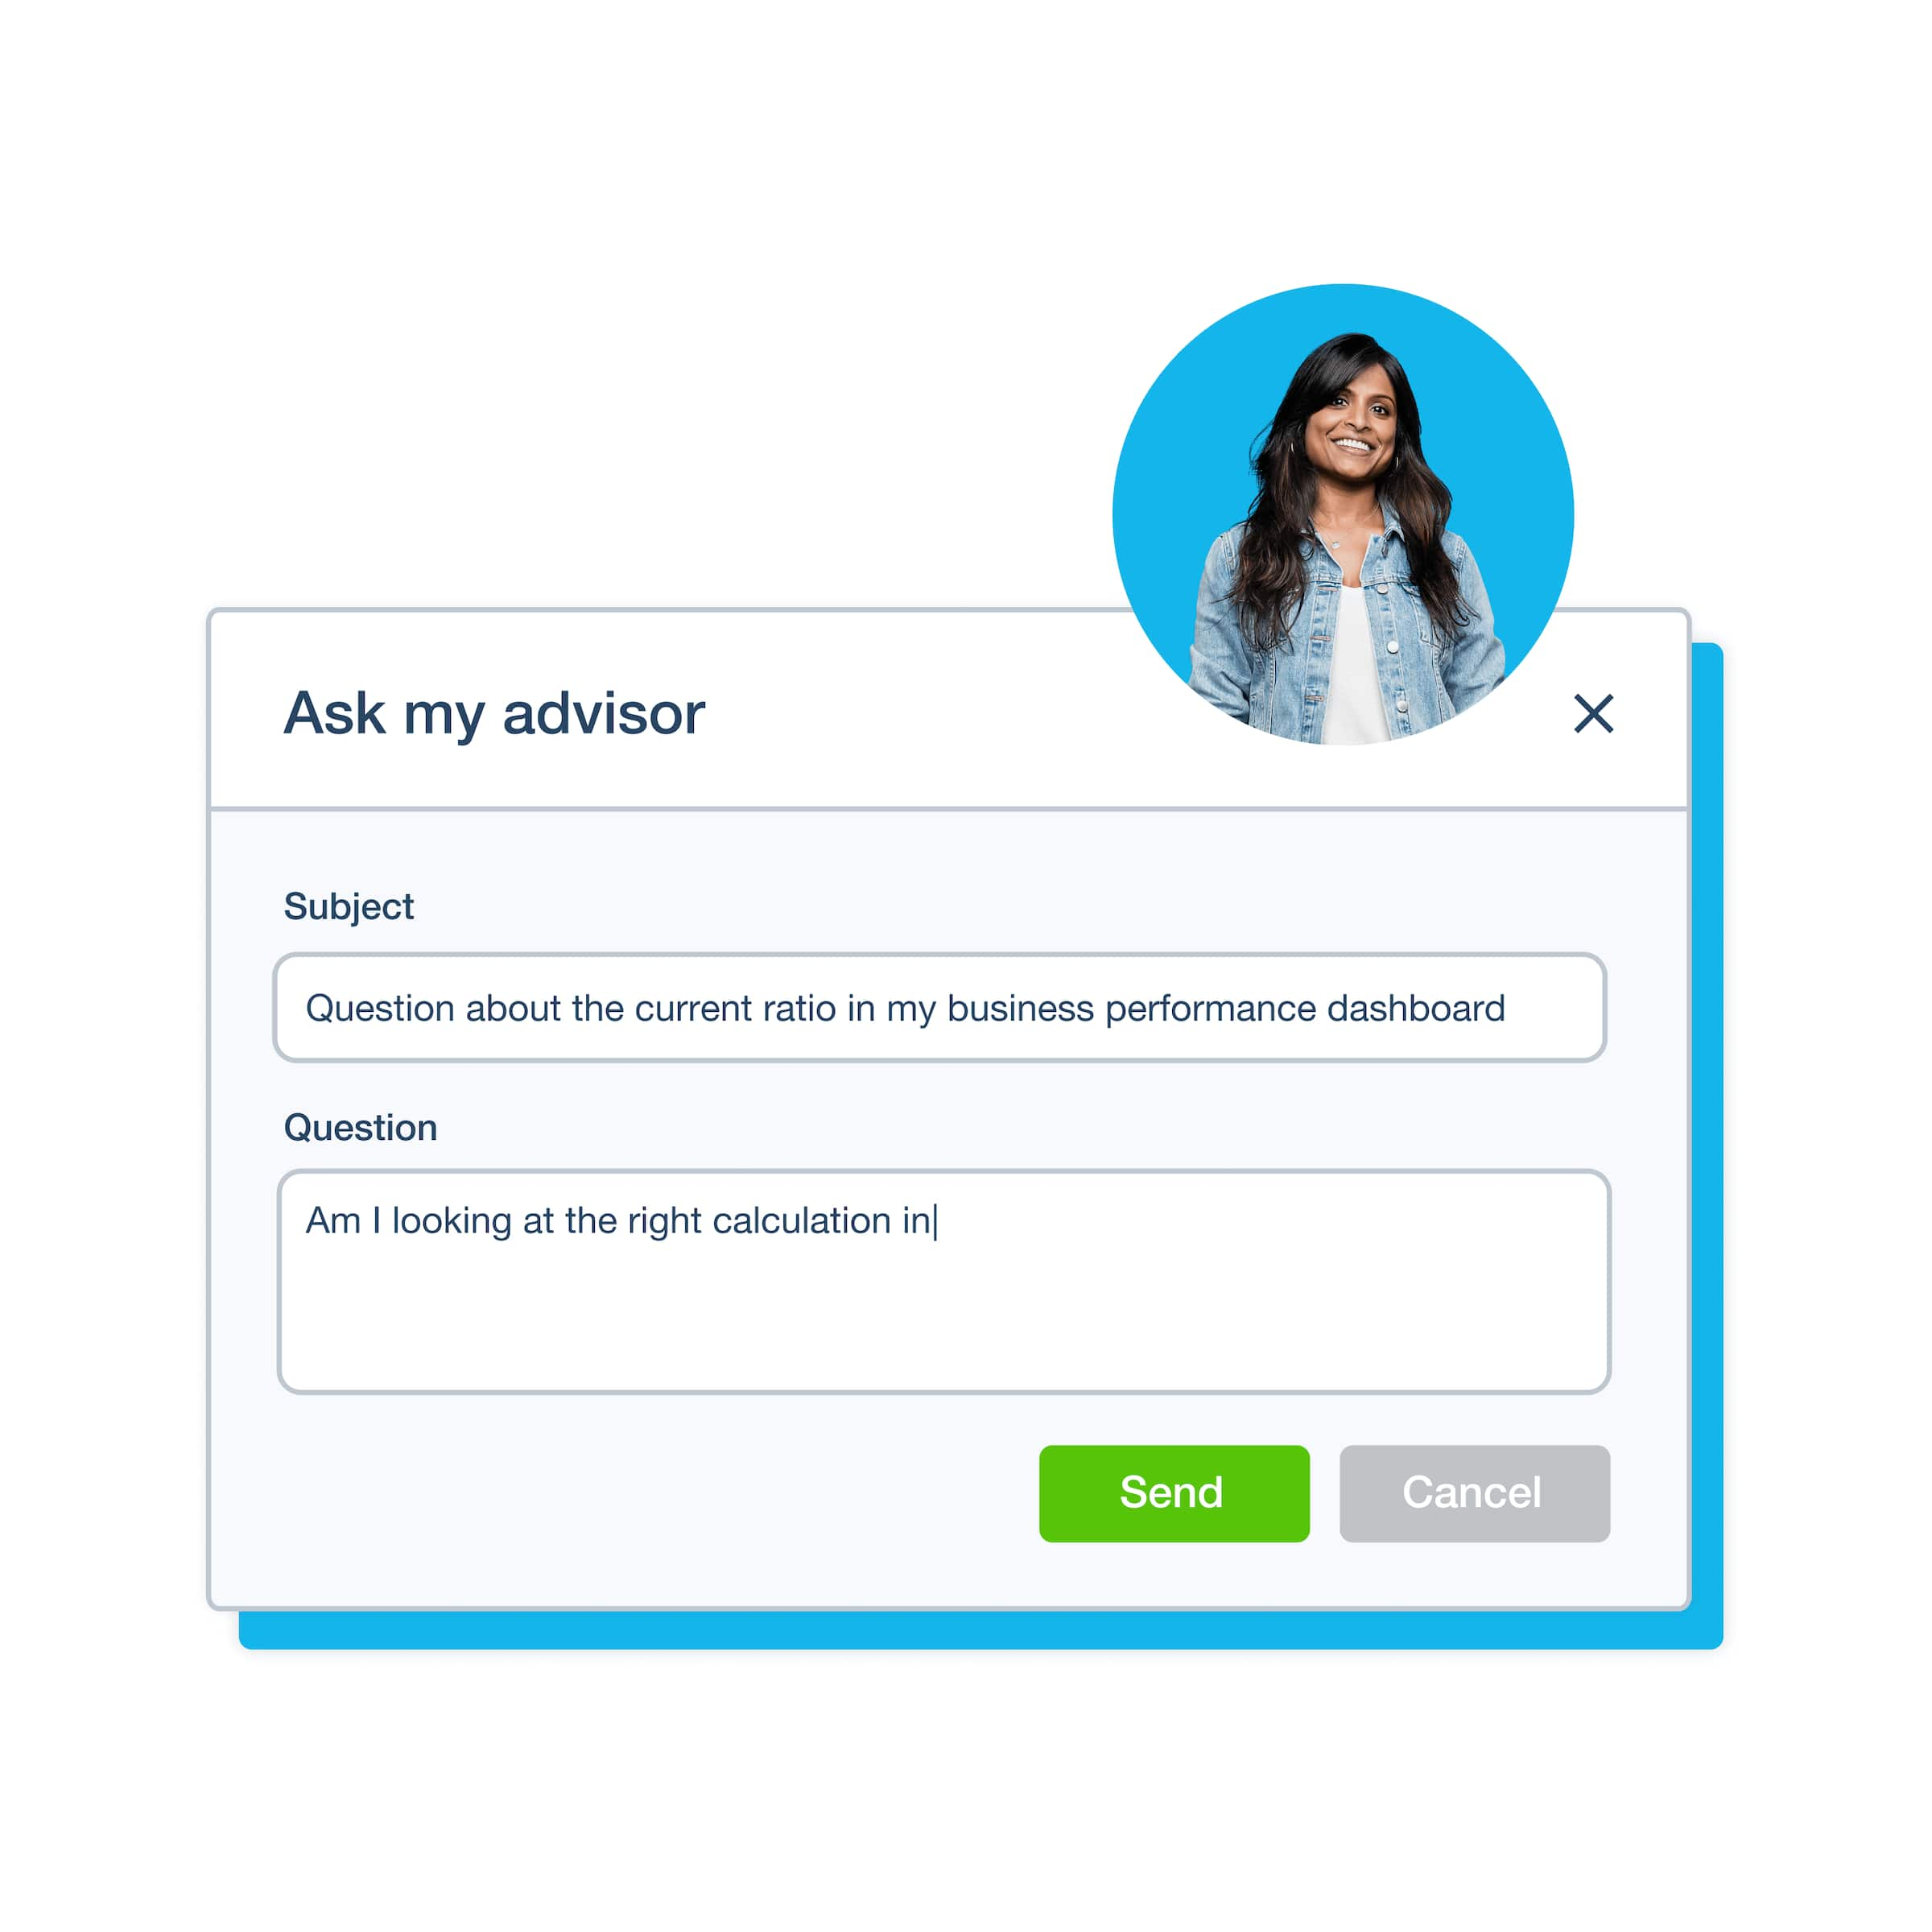
- Work on the same set of numbers as your accountant during online meetings
See your favorite metrics at a glance
Add the metrics you use most often when goal setting right in front of you on your Xero dashboard. No more sifting through data – just the numbers you need for your financial processes in one place, ready for a quick download before your next meeting or a check on your business goals.
How Xero empowers your small business
Xero’s performance management software for small businesses allows you to:
Stay on top of your financials
Help your business thrive by knowing precisely what’s what with your profit and other metrics.
Spot trends early
It can be important for businesses to adapt well to change. Xero helps you spot opportunities /pitfalls early!
Make confident business decisions
Xero’s business performance software gives you the data-based insights you need for informed plans.
FAQs about Xero business performance software
Your Xero dashboard displays a range of graphs that help answer questions like "How much margin do I make on my sales?" and "How easily can I pay my bills?". If you want to go deeper, click on a specific area – such as invoices owed to you – for more detailed information. Choose a date range, compare figures over different periods, and customize graphs to better understand what’s happening in your business.
Here’s more info on the business performance dashboardYour Xero dashboard displays a range of graphs that help answer questions like "How much margin do I make on my sales?" and "How easily can I pay my bills?". If you want to go deeper, click on a specific area – such as invoices owed to you – for more detailed information. Choose a date range, compare figures over different periods, and customize graphs to better understand what’s happening in your business.
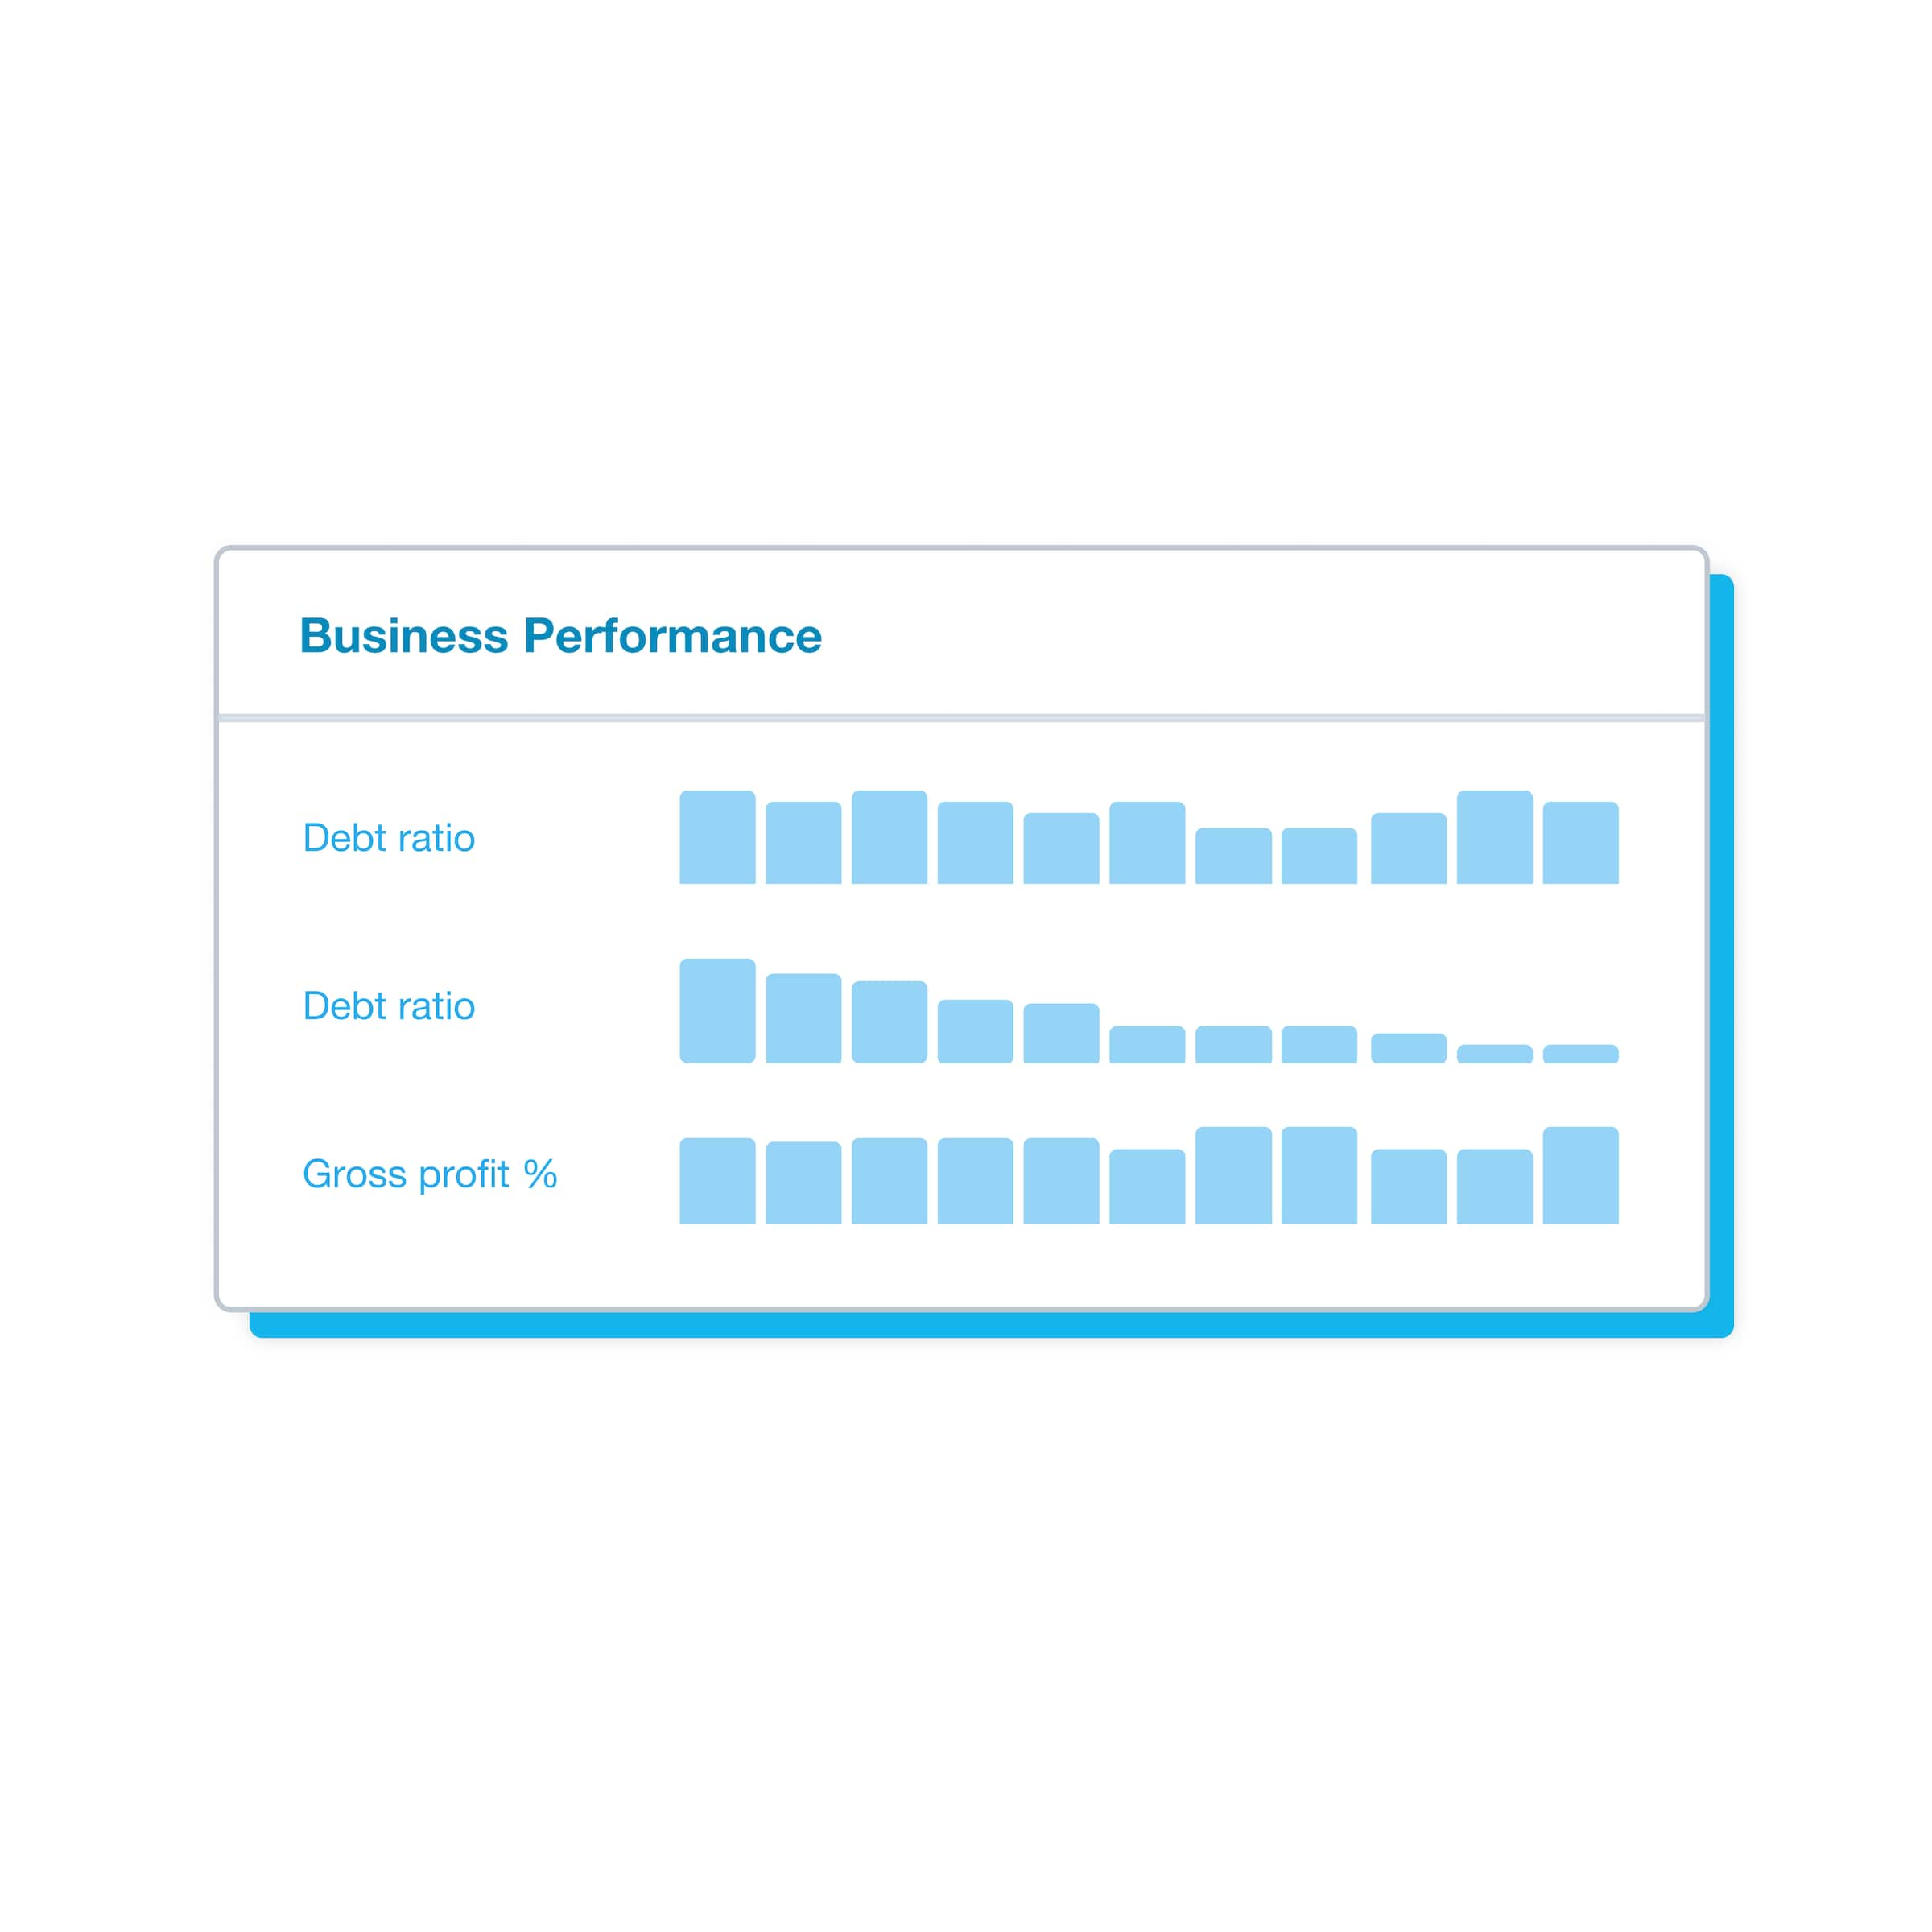
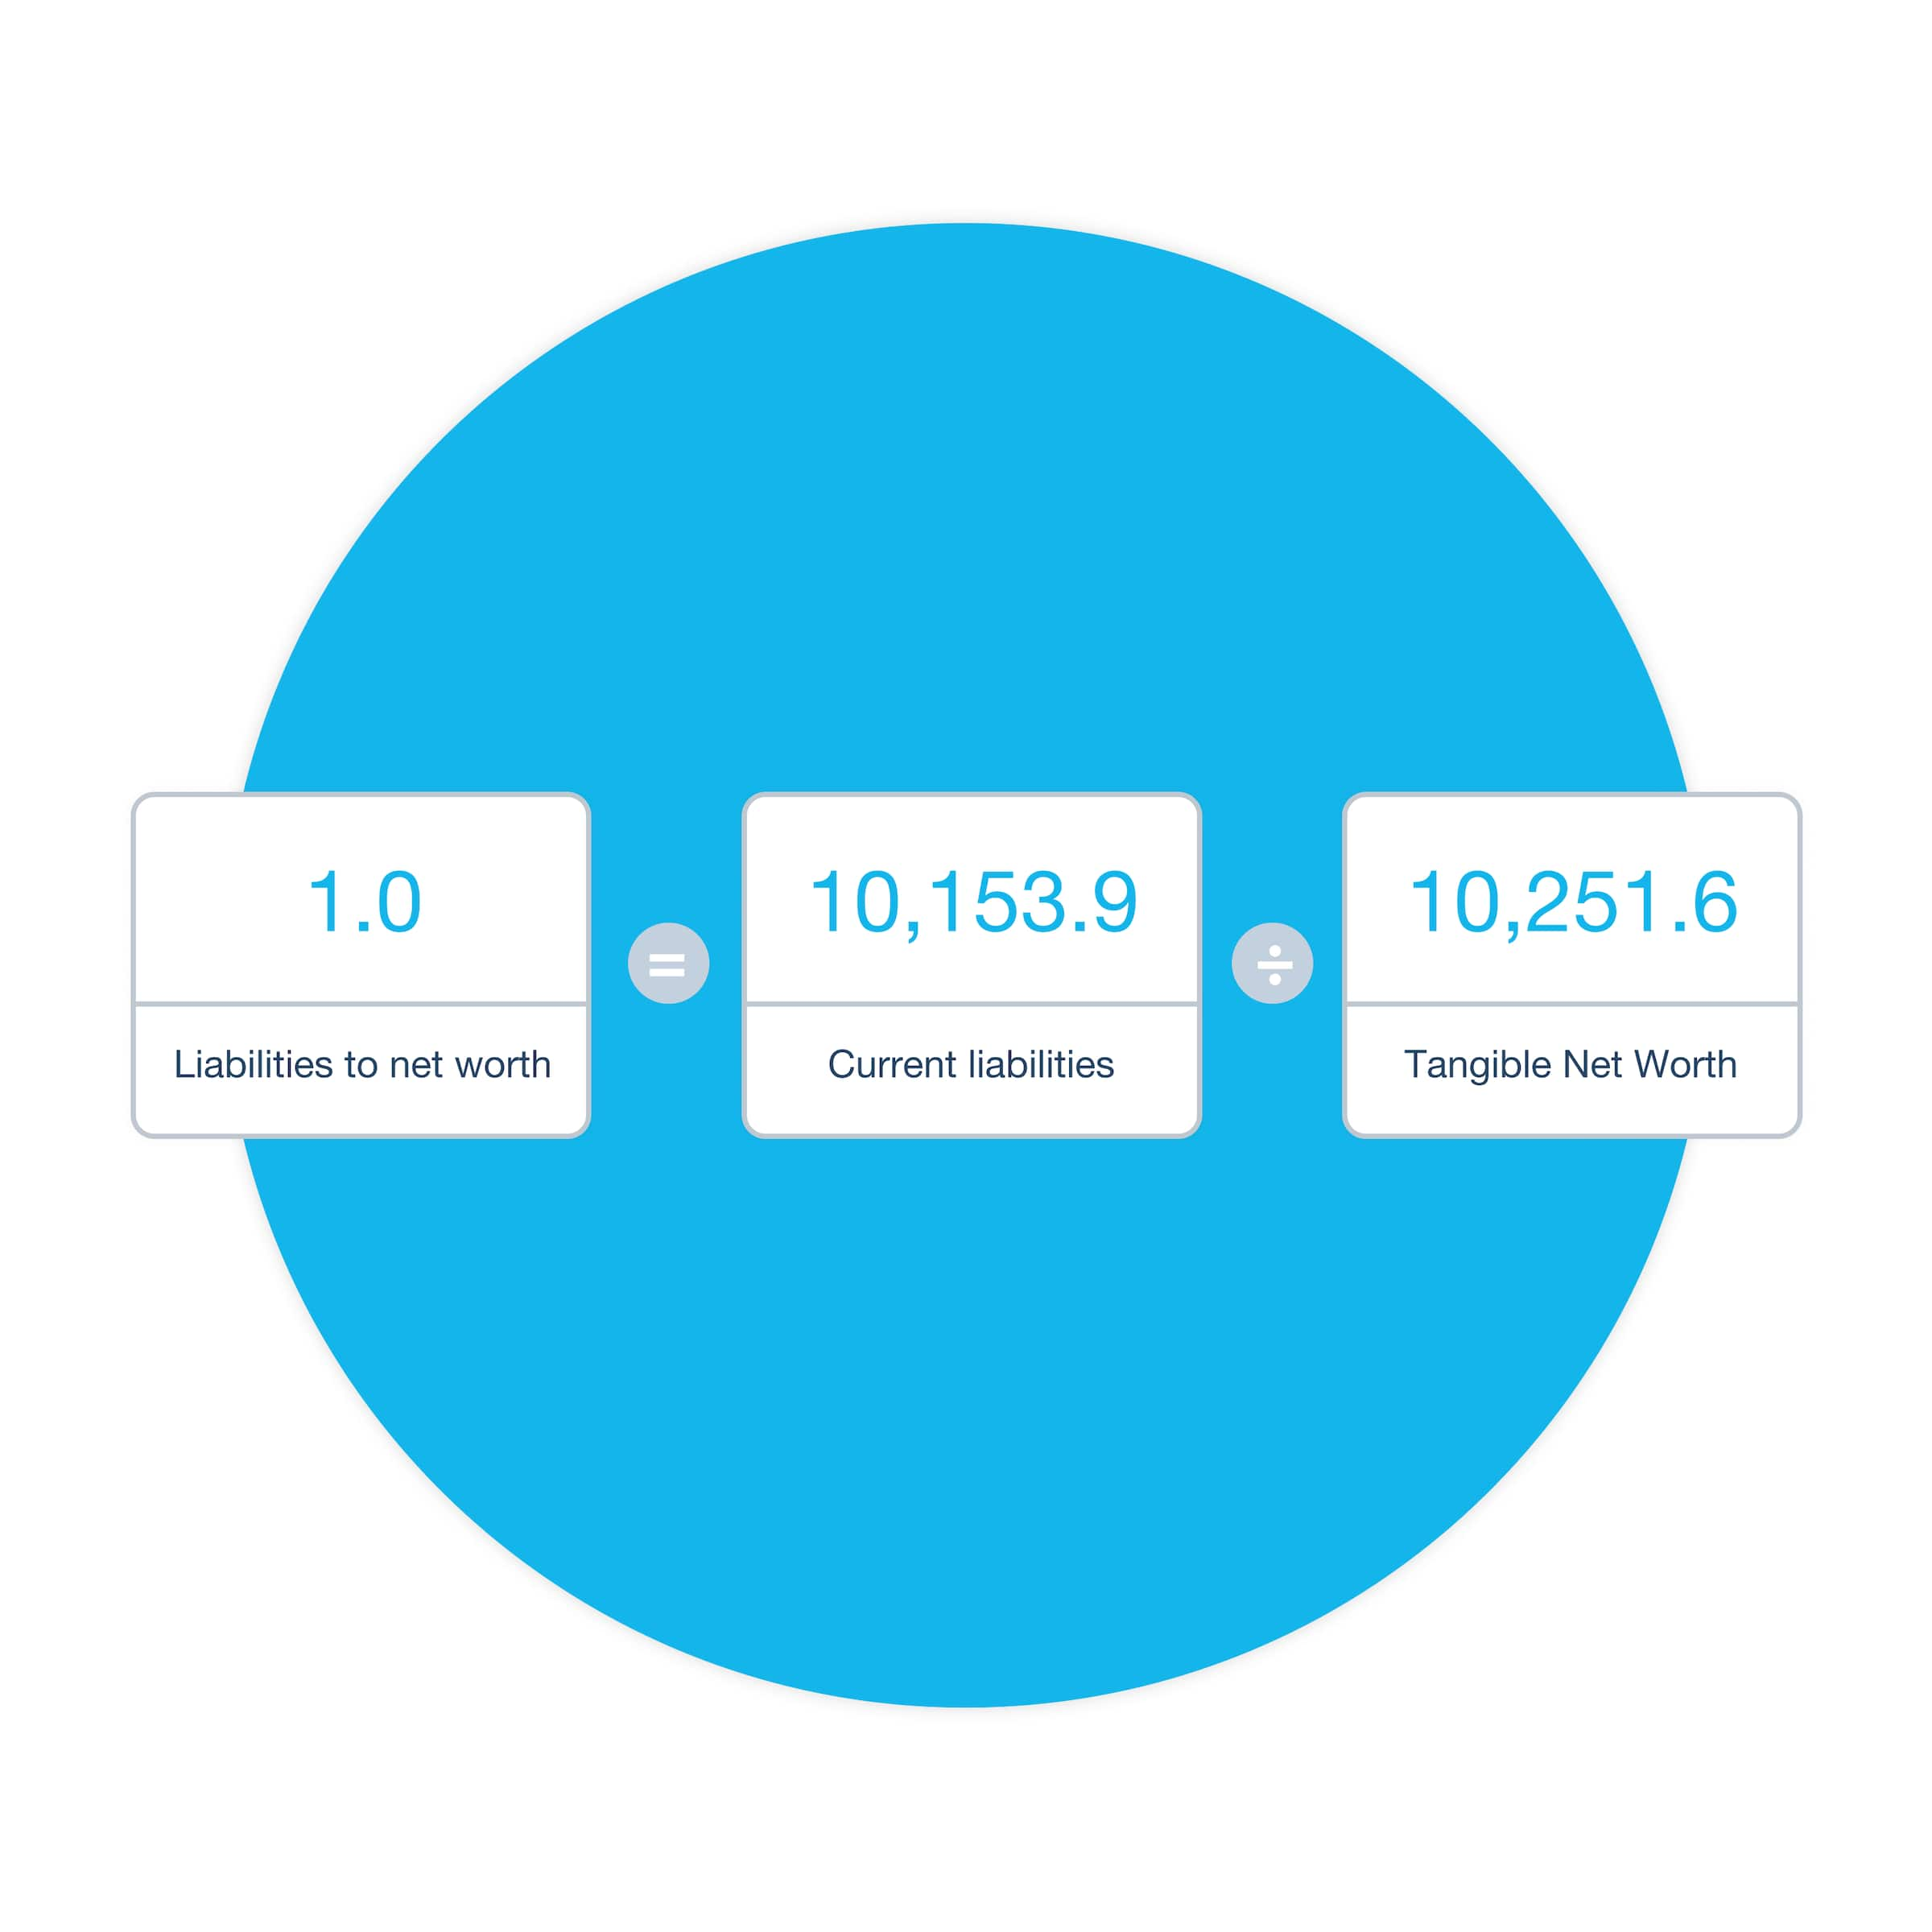
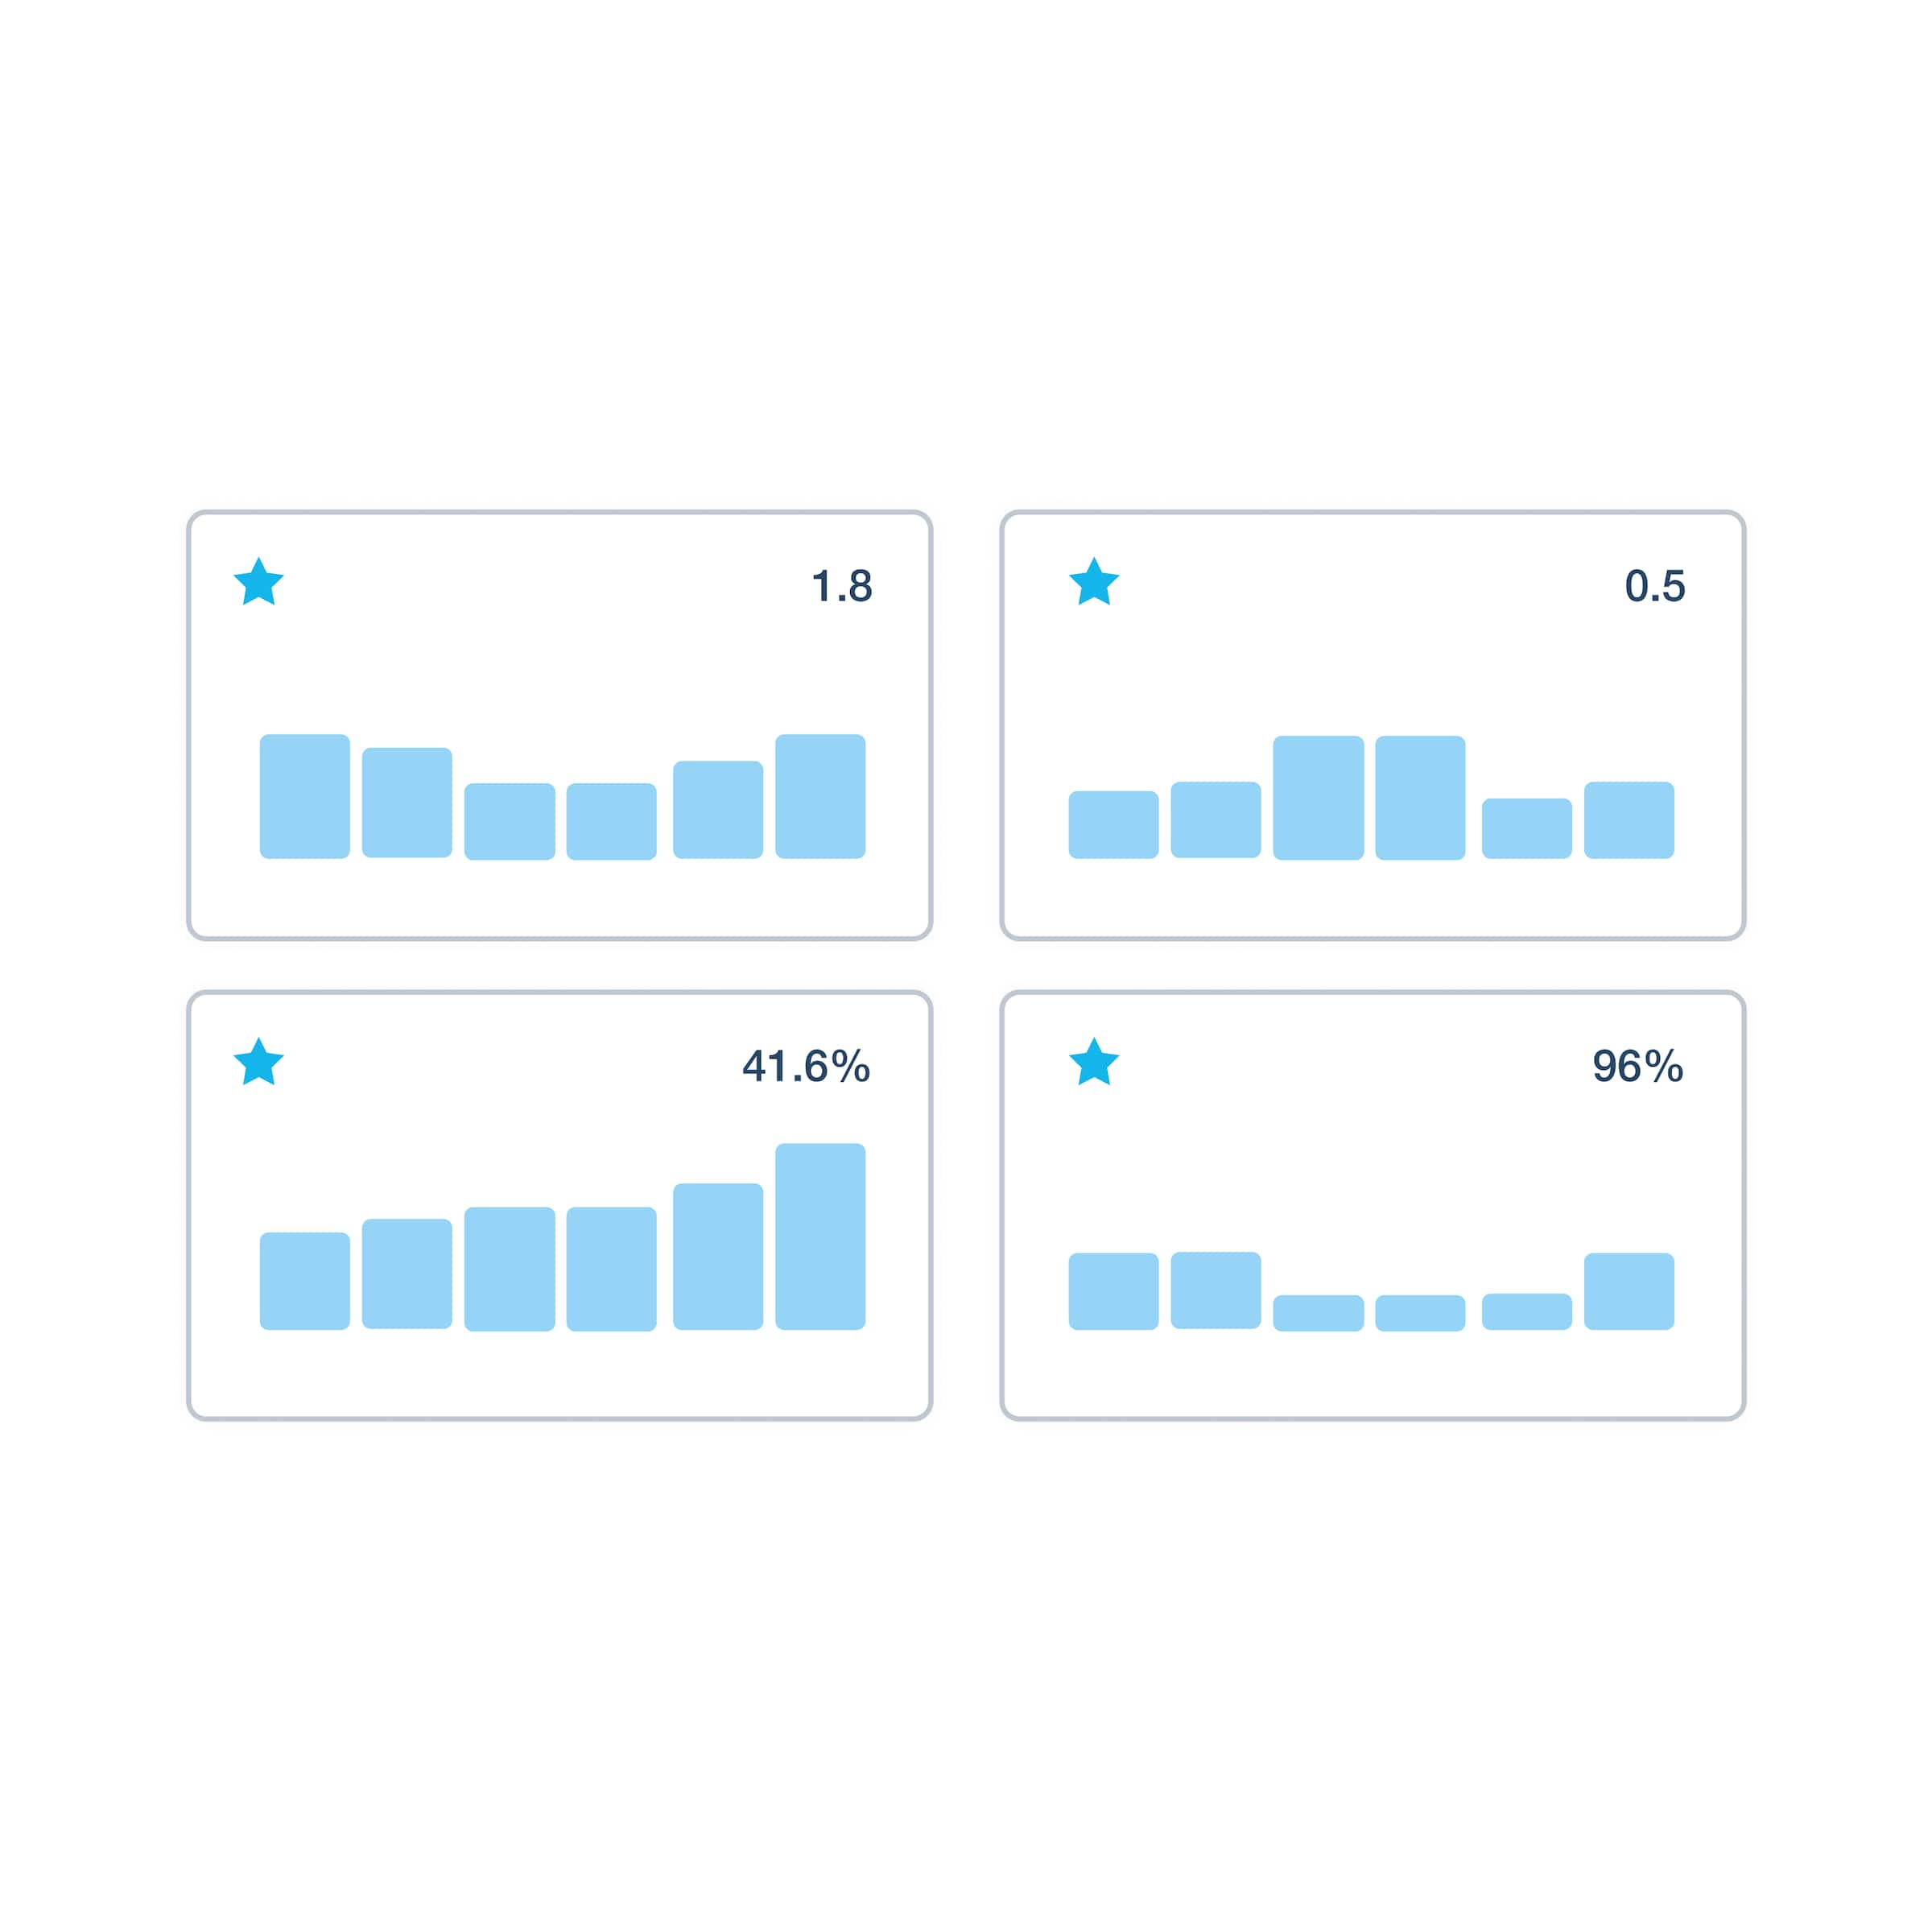
Here’s more info on the business performance dashboardXero’s business performance graphs help you monitor key metrics like debt ratios and gross profit. When you click on a graph’s title, Xero shows you the equation the graph is based on, your monthly results, and your 12-month average result.
Xero’s business performance graphs help you monitor key metrics like debt ratios and gross profit. When you click on a graph’s title, Xero shows you the equation the graph is based on, your monthly results, and your 12-month average result.
First, choose an area to focus on. For example, you may have noticed difficulties with your cash flow and want to monitor the cash coming in and out of your business. Organize your Xero dashboard to show this metric at the top of the screen and then, over the next weeks or months, regularly check the bar charts to see how you’re faring.
Check out more features of Xero softwareFirst, choose an area to focus on. For example, you may have noticed difficulties with your cash flow and want to monitor the cash coming in and out of your business. Organize your Xero dashboard to show this metric at the top of the screen and then, over the next weeks or months, regularly check the bar charts to see how you’re faring.
Check out more features of Xero softwareKPIs (key performance indicators) are quantifiable measures you use to track your business performance. KPIs like total income generated from sales (expressed as a number), or your operating profit margin (expressed as a percentage), are great ways to track your progress towards your business goals.
KPIs (key performance indicators) are quantifiable measures you use to track your business performance. KPIs like total income generated from sales (expressed as a number), or your operating profit margin (expressed as a percentage), are great ways to track your progress towards your business goals.
Evaluate your business performance by setting goals and identifying KPIs. Use a performance management system for small businesses, like Xero, to help track revenue, expenses, and growth. Regularly review these insights, benchmark against competitors, and stay updated on industry trends to help you evaluate performance and make informed business decisions.
Learn about running financial reports with XeroEvaluate your business performance by setting goals and identifying KPIs. Use a performance management system for small businesses, like Xero, to help track revenue, expenses, and growth. Regularly review these insights, benchmark against competitors, and stay updated on industry trends to help you evaluate performance and make informed business decisions.
Learn about running financial reports with Xero
Accounting software for your US small business
Run your business accounting online with Xero. Easy-to-use accounting software, designed for your small business.
- Everything in one place
- Connect to your bank
- Collaborate in real time
- Customize to suit your needs
Pay your bills at no extra cost
Free standard ACH bill payments are now included in Xero business plans.*
Early
for the first 3 months
Then $25 per month
An easy financial foundation - track cash flow with the essentials.
- Send quotes and 20 invoices†
- Accept online invoice payments^
- 5 bills
- Reconcile bank transactions
- Smart Document Capture
- View real-time reports
- W-9 + 1099 management
- Sales tax
- Visualize performance with basic graphs
- 30 day cash flow forecast
- Make online bill payments (Domestic - Free ACH)
- Make online bill payments (Cross Border)

Growing
for the first 3 months
Then $55 per month
Go beyond the basics - automate tasks and access performance dashboards.
- Send invoices and quotes
- Accept online invoice payments^
- Automate bill entry and track bills
- Auto-reconcile bank transactions (Beta)
- Smart Document Capture
- View real-time reports
- W-9 + 1099 management
- Sales tax
- Visualize performance with graphs
- 60 day cash flow forecast
- Make online bill payments (Domestic - Free ACH)
- Make online bill payments (Cross Border)
- Customize performance dashboards
- Tailored financial health scorecards
Forecast with clarity
Forecast with clarity
Established
for the first 3 months
Then $90 per month
Future proof your scaling business - with advanced tools and analytics.
- Send invoices and quotes
- Accept online invoice payments^
- Automate bill entry and track bills
- Auto-reconcile bank transactions (Beta)
- Smart Document Capture
- View real-time reports
- W-9 + 1099 management
- Sales tax
- Visualize performance with graphs
- 180 day cash flow forecast
- Make online bill payments (Domestic - Free ACH)
- Make online bill payments (Cross Border)
- Customize performance dashboards
- Tailored financial health scorecards
- Analyze KPIs and ratios
- Use multiple currencies
- Track time and costs for projects
- Employee expense and mileage claims
- Benchmark against the industry
- Make online bill payments (International)
Get one month free
Purchase any Xero plan, and we will give you the first month free.
*Fees apply for other payment methods.