How to measure profitability: margin formulas and tips
Learn how to calculate and track profitability metrics to keep your small business financially healthy.

Written by Jotika Teli—Certified Public Accountant with 24 years of experience. Read Jotika's full bio
Published Tuesday 26 May 2026
Table of contents
Key takeaways
- Calculate your gross profit margin by subtracting cost of goods sold from revenue, then dividing by revenue and multiplying by 100 to see how much money remains after direct costs to fund your operating expenses.
- Track your net profit margin monthly by dividing net profit by total revenue and multiplying by 100, as this shows your overall business health and helps you spot problems before they become serious.
- Use accounting software to automate profitability calculations and generate real-time reports, which saves time and reduces errors compared to manual tracking methods.
- Improve low profit margins by increasing prices, negotiating better supplier costs, or cutting unnecessary operating expenses like unused subscriptions and overhead costs.
What profitability means in small business
Profitability measures how effectively your business turns revenue into profit. It's expressed as a percentage using this formula: (Profit / Revenue) x 100.
The main profitability metrics are gross profit margin and net profit margin. These ratios show what percentage of sales revenue you keep after paying business costs.
Your profitability percentage tells you:
- High profitability (fat margins): You keep a large portion of revenue as profit. This is generally positive, though it may signal room to lower prices and boost sales volume.
- Low profitability (thin margins): Most revenue goes toward expenses. This could mean costs are too high, prices are too low, or you're competing in a price-sensitive market.
Profit is the dollar amount your business keeps after paying expenses. Profitability is the percentage of revenue you retain versus what you spend to operate.
Why does this matter? High profitability only improves your bottom line when paired with strong revenue. You need both good margins and good sales.
Profitability metrics
Profitability metrics (also called profitability ratios) measure how much of your revenue converts to profit at different stages of your business operations. Understanding each metric helps you pinpoint exactly where money is being lost or retained.
The three most common metrics for small businesses are:
- Gross profit margin: profit after direct costs
- Operating profit margin: profit after operating expenses
- Net profit margin: profit after all expenses
Gross profit margin

Gross profit margin shows the percentage of revenue remaining after you pay direct costs (cost of goods sold or COGS). These are costs directly tied to producing your product or delivering your service.
Formula: (Revenue - COGS) / Revenue x 100
Why it matters: Gross profit funds your operating expenses like rent, utilities, marketing, and administration. What remains after those costs becomes your net profit.
Operating profit margin
Operating profit margin shows the percentage of revenue remaining after paying both direct costs and operating expenses, but before interest and taxes. It isolates how well you run the day-to-day operations of your business.
Formula: (Revenue - COGS - Operating Expenses) / Revenue x 100
Why it matters: Operating margin reveals how efficiently you run day-to-day operations, separate from financing decisions and tax obligations. It's useful for comparing performance across periods or against competitors in your industry.
Net profit margin

*Net profit can be quoted before or after taxes. If quoting after-tax net profit then you need to also subtract taxes.
Net profit margin shows the percentage of revenue remaining after paying all business costs, including operating expenses, interest, and taxes. This is the most comprehensive profitability measure.
Formula: Net Profit / Revenue x 100
Why it matters: Net profit is what your business keeps. You can reinvest it in growth or distribute it to owners. Net profit can be calculated before or after taxes; this guide uses pre-tax net profit.
Additional profitability metrics
Beyond the three core margins, two additional metrics give you a fuller picture of your business's financial performance. These are especially useful when you're making investment decisions or planning for growth.
Return on assets (ROA)

Return on assets measures how efficiently your business uses its assets to generate profit. It tells you whether the equipment, inventory, and other resources you've invested in are pulling their weight.
Formula: (Net Income / Total Assets) x 100
Why it matters: ROA helps you evaluate whether your asset investments are paying off. A higher ROA means you're generating more profit per dollar of assets. If your ROA is declining, it may be time to sell underperforming assets or find ways to generate more revenue from what you already own.
Break-even analysis
Break-even analysis tells you the minimum revenue you need to cover all your costs before you start making a profit. It's one of the most practical tools for pricing decisions and financial planning.
Formula: Fixed Costs / (Revenue per Unit - Variable Cost per Unit)
Why it matters: Knowing your break-even point helps you set realistic sales targets and pricing. If you're launching a new product or service, break-even analysis shows exactly how many units you need to sell (or how much revenue you need to earn) before turning a profit.
How to use profitability metrics
Each profitability metric serves a different purpose in managing your business. Knowing when to use each one helps you make better decisions faster.
- Gross profit margin: Use this to evaluate pricing and direct costs. If gross margin is shrinking, review supplier costs or adjust your prices.
- Operating profit margin: Use this to assess operational efficiency. A declining operating margin may signal rising overhead or inefficient processes.
- Net profit margin: Use this to measure overall business health. Track it monthly to spot trends before they become problems.
- Return on assets: Use this when evaluating large purchases or investments. It shows whether your assets are generating enough return.
- Break-even analysis: Use this when launching new products, adjusting prices, or planning for a slow season.
Comparing your margins over time helps you identify patterns. Comparing against industry benchmarks shows where you stand relative to competitors.
How to calculate profitability
The profitability formula is: (Profit / Revenue) x 100 = Profitability percentage. The specific profit figure you use depends on which metric you're calculating.
- Gross profit margin: use gross profit (revenue minus cost of goods sold)
- Net profit margin: use net profit (revenue minus all expenses)
How to calculate gross profit margin
Calculating gross profit margin takes just three steps. This is the fastest way to check whether your pricing covers your direct costs.
- Subtract your cost of goods sold from your revenue to get gross profit
- Divide gross profit by revenue
- Multiply by 100 to get the percentage
Try the gross margin calculator to run the numbers instantly.
How to calculate net profit margin
Net profit margin accounts for every expense your business incurs. Here's how to calculate net profit margin step by step.
- Subtract all expenses (including COGS, operating costs, interest, and taxes) from revenue to get net profit
- Divide net profit by revenue
- Multiply by 100 to get the percentage
Try the net profit margin calculator to run the numbers instantly.
Example of profitability calculation
Here's a worked example to show how these formulas come together. Consider a business with $100,000 in sales, $60,000 in inventory costs (COGS), and $20,000 in general expenses.
Step 1: Calculate gross profit. $100,000 revenue - $60,000 COGS = $40,000 gross profit.
Step 2: Calculate gross profit margin. $40,000 / $100,000 x 100 = 40% gross profit margin.
Step 3: Calculate net profit. $100,000 revenue - $80,000 total costs = $20,000 net profit.
Step 4: Calculate net profit margin. $20,000 / $100,000 x 100 = 20% net profit margin.
Profitability benchmarks by industry
Profit margins vary widely depending on the industry you operate in. Knowing where your industry falls helps you set realistic targets and understand whether your margins are competitive.
Here are typical net profit margins by industry (source: Vena Solutions, February 2026):
- Banks and financial services: approximately 30% net margin
- Software companies: 20%+ net margin
- Business and consumer services: approximately 7% net margin
- Retail (general): 3-5% net margin
- Grocery and food retail: 1-2% net margin
- Average across all industries: approximately 8.5% net margin
These figures are averages, so individual businesses may fall above or below these ranges. Use them as a starting point for comparison, not as a strict target. Your accountant or bookkeeper can help you find the most relevant benchmarks for your specific business type.
Where to find the numbers to calculate profitability
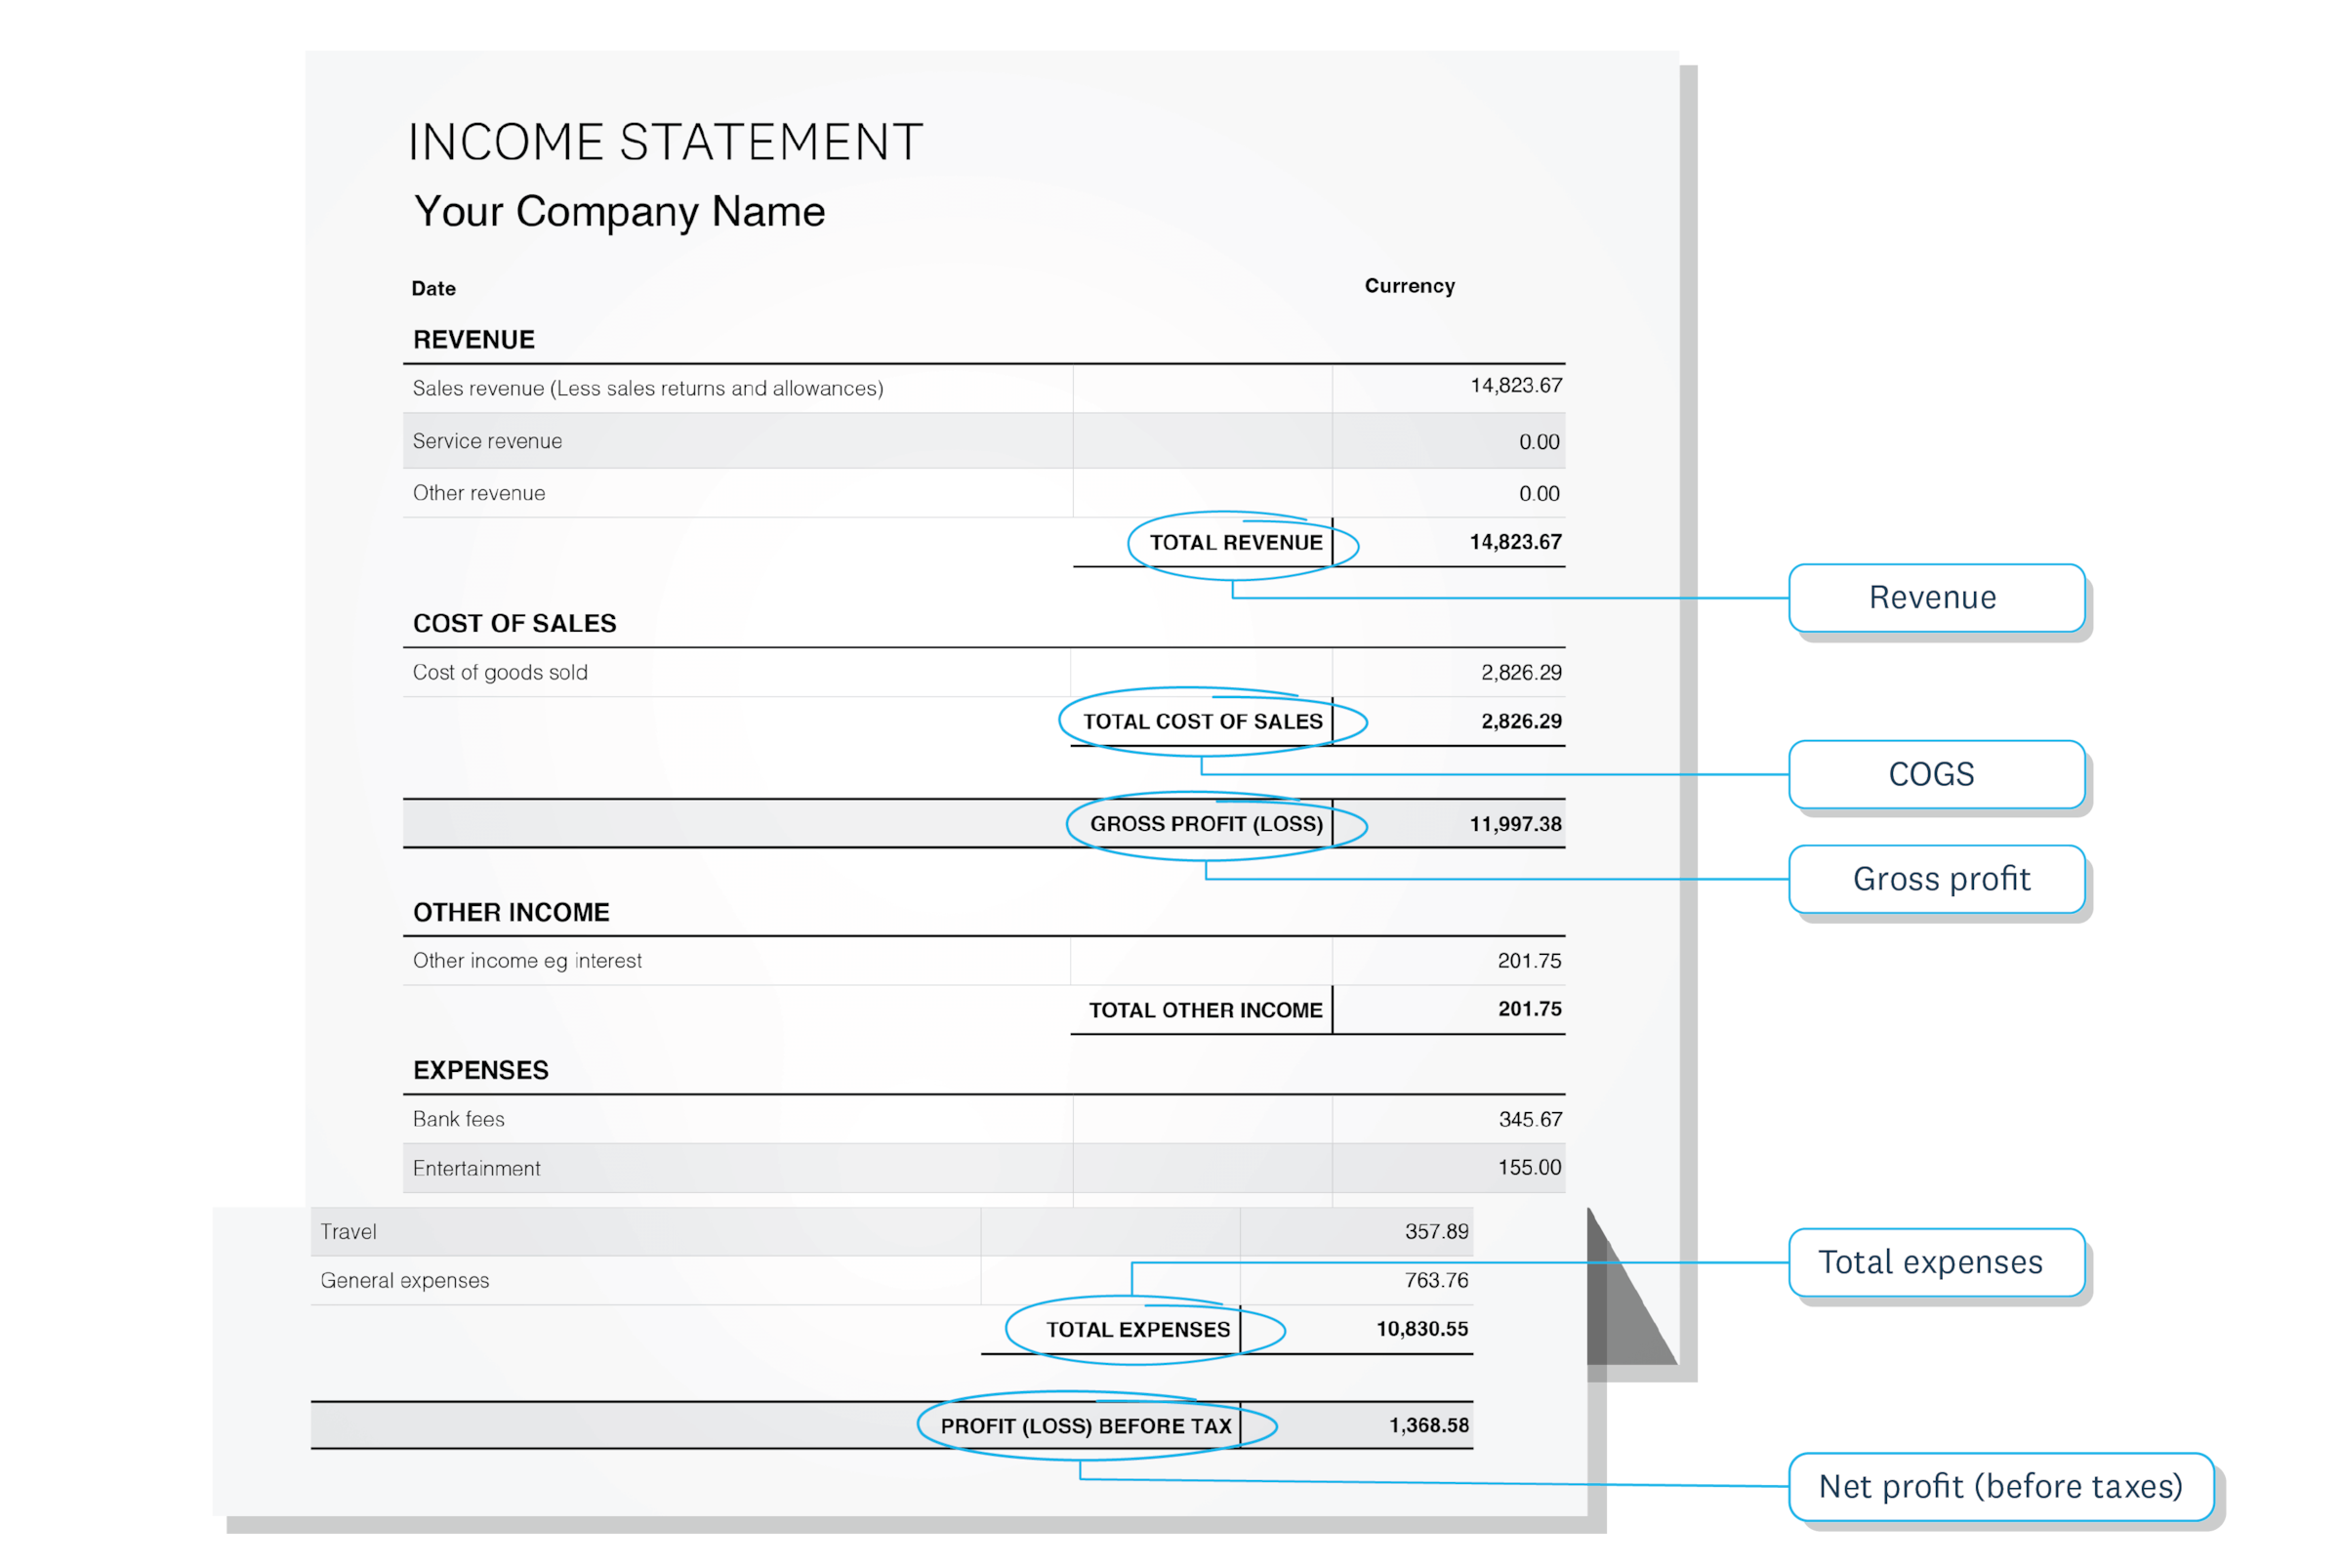
You need three figures to calculate profitability: revenue, cost of goods sold, and total expenses. Here's where to find them in your financial records.
- Revenue: Check your income statement (also called a profit and loss statement) under "Sales" or "Total Revenue."
- Cost of goods sold (COGS): Listed on your income statement, typically below revenue. Includes direct costs like materials, inventory, and labor directly tied to production.
- Total expenses: Sum of COGS plus operating expenses (rent, utilities, salaries, marketing, insurance).
If you use accounting software like Xero, these figures appear in your standard reports. You can also use an income statement template to organize the numbers. You can also pull them from your bank statements and receipts if you're tracking manually.
How to calculate profitability with software
Accounting software automates profitability calculations, saving you time and reducing errors. Instead of pulling numbers from spreadsheets, you can view your margins in real time.
With Xero, you can:
- View real-time margins: Open Xero Analytics and select your reporting period to see gross and net profit margins instantly.
- Generate income statements: Pull a profit and loss report anytime to review revenue, costs, and profit figures.
- Track trends over time: Compare margins across months or quarters to spot patterns.
You can also calculate manually using your income statement if you prefer to double-check the numbers.
What's a good profit margin for your business?
A "good" profit margin depends on your industry, business model, and growth stage. Here are some general benchmarks to help you gauge where you stand.
- Gross profit margin: 50-70% for service businesses; 20-50% for retail and product businesses
- Net profit margin: 10-20% is considered healthy for most small businesses; 5-10% is common in competitive or low-margin industries
These are starting points, not targets. Your ideal margin depends on factors like:
- Industry norms: Grocery stores operate on 1-2% net margins, while software companies often exceed 20%.
- Business stage: New businesses often have lower margins as they invest in growth.
- Pricing strategy: Premium positioning supports higher margins; volume strategies accept lower margins.
- Economic conditions: Broader economic shifts affect costs and customer spending. According to Xero Small Business Insights, monthly data shows US small business conditions can shift quickly, making it important to review margins against current economic trends.
Compare your margins against your own history first. Then benchmark against industry averages. Your accountant or bookkeeper can help identify realistic targets for your specific situation.
Why you should track profitability regularly
Tracking profitability regularly helps you catch margin changes before they become cash flow problems. The earlier you spot a shift, the more options you have to respond.
According to Xero Small Business Insights, US small business sales growth averaged just 2.4% year-over-year in 2025, roughly half the long-term average of 5.5%. When revenue growth is this modest, even small margin changes can have a big impact on your bottom line.
Your margins can shift due to:
- Rising costs: raw materials, energy, transport, and rent
- Interest rate changes: affecting loan payments and financing costs
- Exchange rate fluctuations: impacting import costs or international sales
- Competitive pressure: forcing price adjustments
How often to calculate: Monthly tracking works for most small businesses. If you operate on thin margins or in a volatile market, review weekly.
Common profitability measurement mistakes
Even experienced business owners can fall into traps when measuring profitability. Avoiding these common mistakes helps you get an accurate picture of your financial health.
Only tracking one metric
Relying on a single profitability metric gives you an incomplete picture. Gross margin, operating margin, and net margin each tell you something different about your business. Track all three together to understand where profits are being made and lost.
Ignoring indirect costs and overhead allocation
It's easy to focus on direct costs and overlook overhead like rent, insurance, and administrative salaries. If you don't allocate indirect costs properly, your profitability numbers will look better than they actually are.
Using single-period analysis instead of trend data
One month's profitability can be misleading. A single strong or weak month doesn't reflect your true performance. Look at trends over several months or quarters to get an accurate view of your margins.
Confusing profit with cash flow
Profit and cash flow are not the same thing. You can be profitable on paper but short on cash if customers pay slowly or you've invested heavily in inventory. Track both metrics separately.
Not adjusting for seasonal variations
Many businesses experience seasonal swings in revenue and costs. Comparing a peak month to a slow month without adjusting for seasonality can lead to poor decisions. Use year-over-year comparisons for a more accurate assessment.
How to improve your profitability
If your margins are lower than you'd like, there are practical steps you can take to turn things around. Focus on these three areas to make the biggest impact.
- Increase prices: Review your pricing strategy. Even small increases can significantly improve margins without losing customers.
- Reduce direct costs (COGS): Negotiate with suppliers, find alternative materials, or improve production efficiency.
- Cut operating expenses: Review recurring costs like subscriptions, utilities, and overhead. Eliminate what you don't need.
Building a small business budget can help you identify which expenses to cut. Set a target margin based on your industry norms and track progress monthly. Your accountant or bookkeeper can help identify realistic benchmarks.
For more detailed strategies, check out the guide on how to increase profits.
Track profitability automatically with Xero
Calculating profitability manually takes time you could spend running your business. Xero automates the process by tracking your revenue and expenses in real time and generating margin reports on demand.
With Xero, you can:
- View gross and net profit margins in your dashboard
- Generate income statements for any period
- Compare profitability trends across months or quarters
- Share reports with your accountant instantly
See how easy profitability tracking can be. Get one month free.
FAQs on measuring profitability
Here are answers to frequently asked questions about measuring profitability for your small business.
What's the difference between profit and profitability?
Profit is the dollar amount remaining after expenses. Profitability is the percentage of revenue that becomes profit. A business can have high profit but low profitability if revenue is also very high. Both figures matter, but profitability is more useful for comparing performance over time or against other businesses.
How do you calculate gross profit margin?
Subtract your cost of goods sold (COGS) from your total revenue to get gross profit. Then divide gross profit by revenue and multiply by 100 to get the percentage. For example, if your revenue is $100,000 and your COGS is $60,000, your gross profit margin is 40%.
Is a 10% profit margin good for a small business?
A 10% net profit margin is generally healthy for most small businesses. However, "good" varies by industry. Grocery stores may operate on 1-2%, while software companies often exceed 20%. Compare your margin to industry benchmarks for a more meaningful assessment.
How often should I calculate profitability?
Calculate profitability monthly for most businesses. If you operate on thin margins or face volatile costs, review weekly to catch changes early. Consistent tracking helps you spot trends before they turn into bigger problems.
Can I be profitable but still run out of cash?
Yes. Profitability measures earnings over time, while cash flow tracks money moving in and out daily. You can show a profit on paper but lack cash if customers pay slowly or you've invested heavily in inventory. Tracking both profitability and cash flow gives you the complete picture.
Disclaimer
Xero does not provide accounting, tax, business or legal advice. This guide has been provided for information purposes only. You should consult your own professional advisors for advice directly relating to your business or before taking action in relation to any of the content provided.
Get one month free
Sign up to any Xero plan, and we will give you the first month free.