KPIs for business: a complete guide for small business owners
Learn how to choose, track, and use KPIs to make smarter decisions for your small business.
Written by Jotika Teli—Certified Public Accountant with 24 years of experience. Read Jotika's full bio
Published Tuesday 9 June 2026
Table of contents
Key takeaways
- A KPI (key performance indicator) is a measurable value that shows how effectively your business achieves its most important goals. Most small businesses should track four to six across efficiency, growth, health, and resilience.
- Good KPIs follow the SMART framework: they're specific, measurable, achievable, relevant, and time-bound, so you can act on them confidently.
- KPIs fall into two broad types, leading indicators that predict future results and lagging indicators that confirm past performance, and you need both for a complete picture.
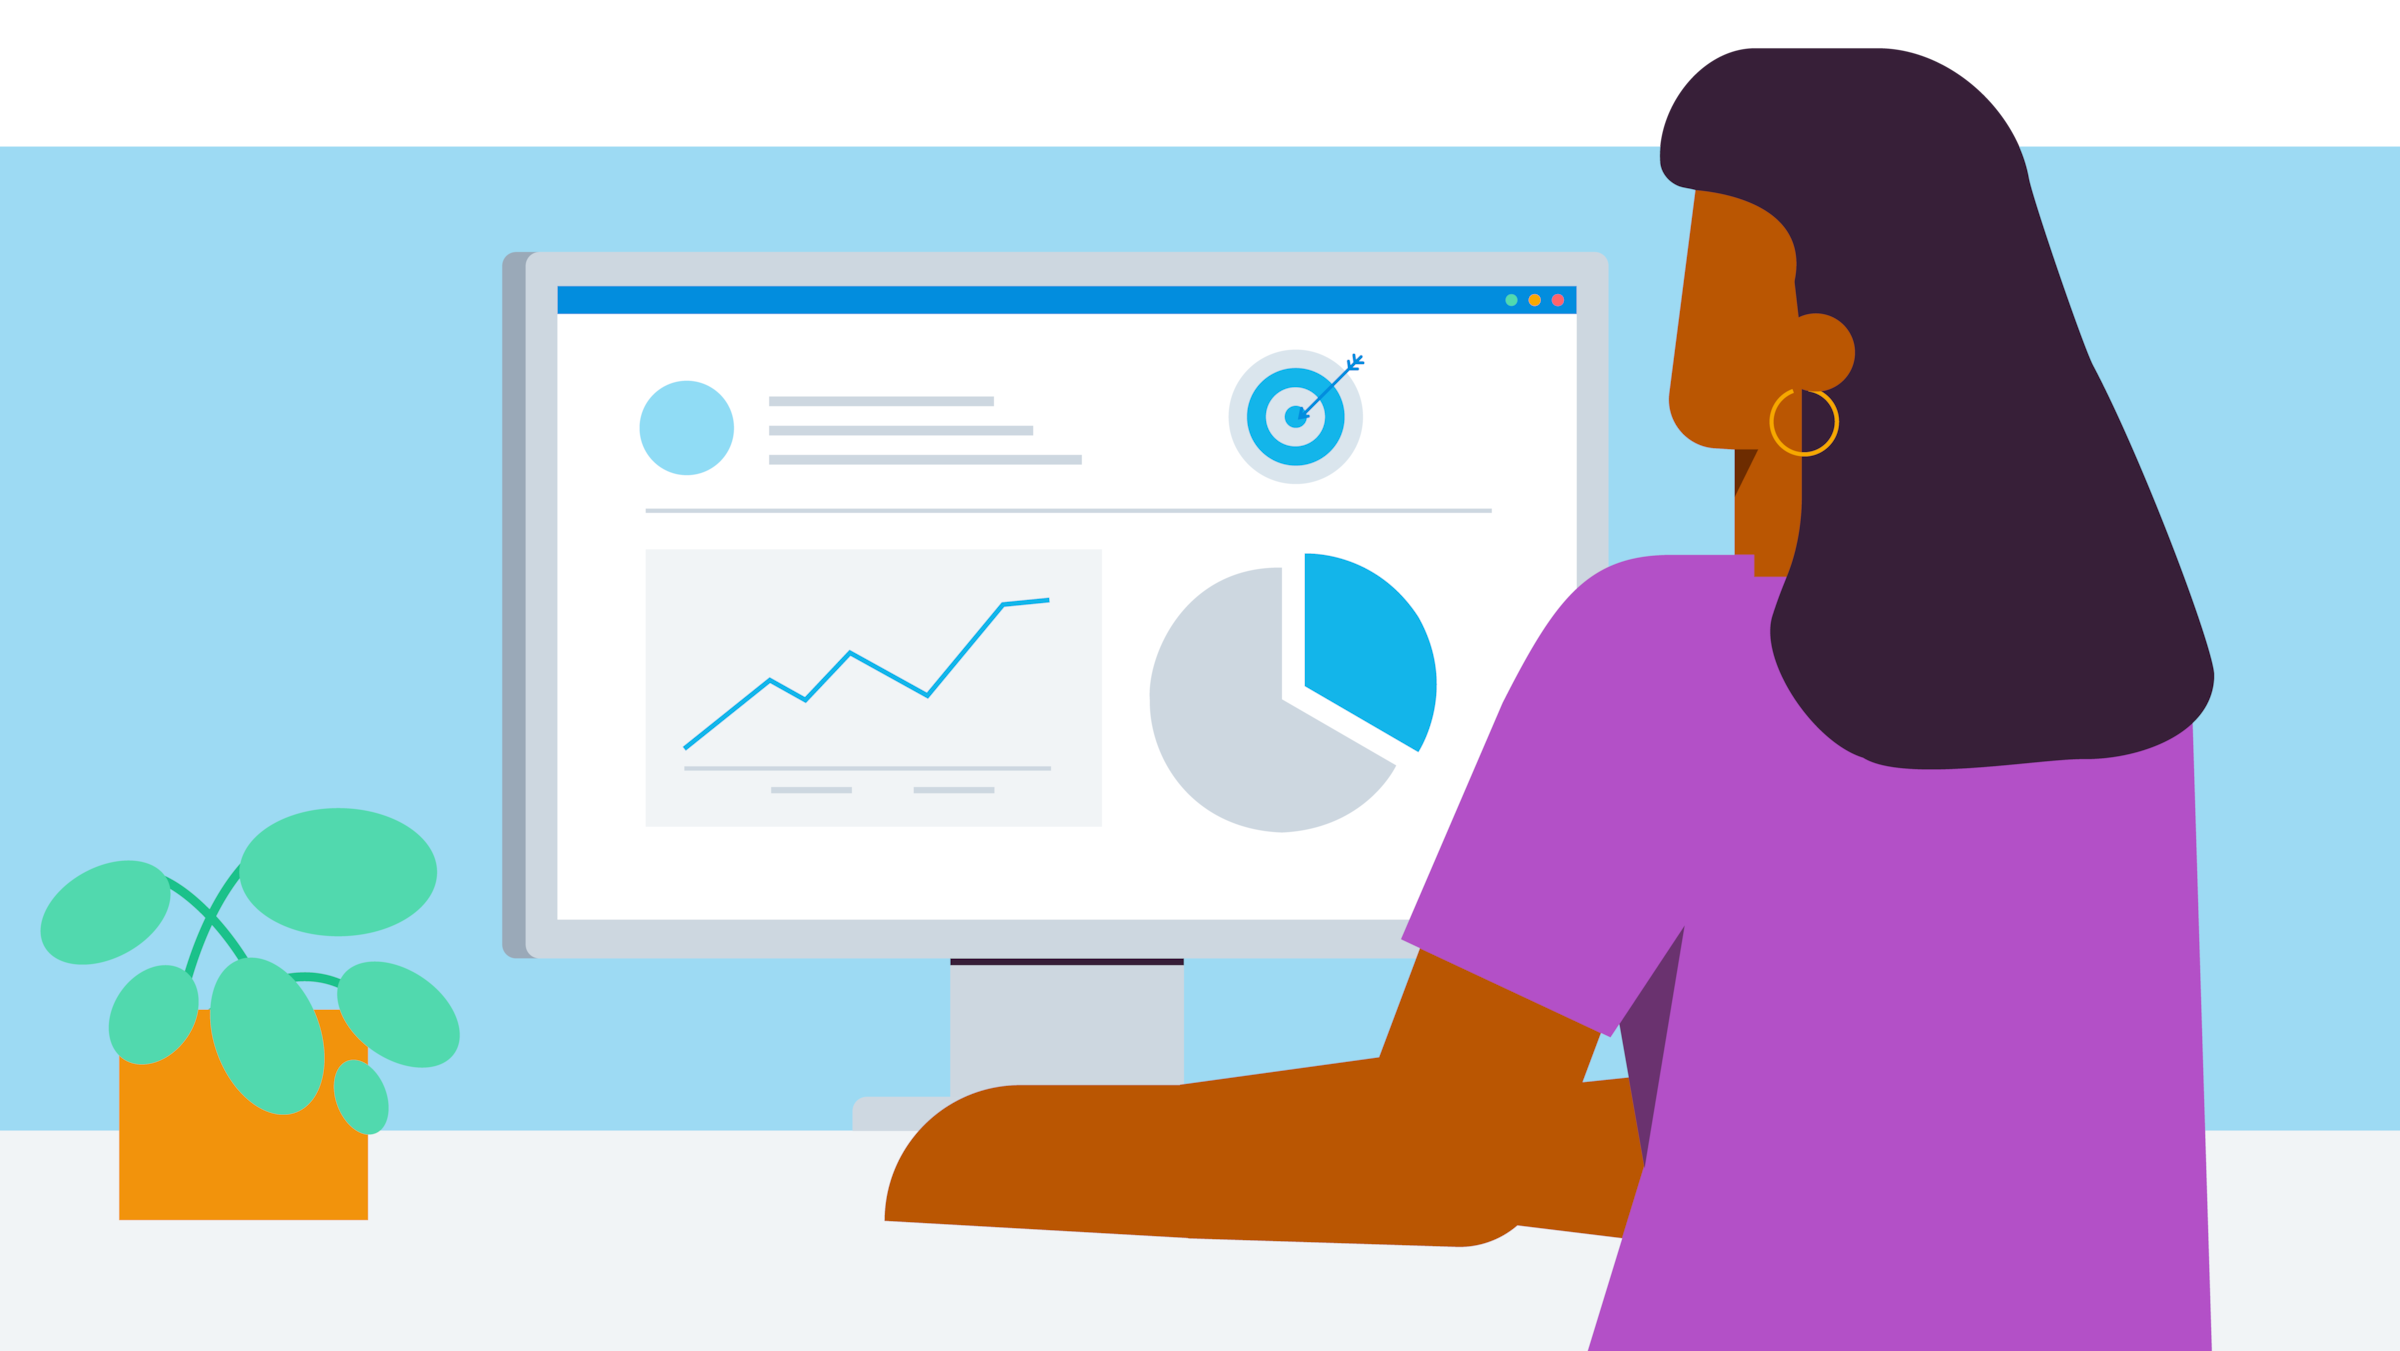
- Cloud accounting software like Xero can automate KPI tracking, giving you real-time visibility into business performance without manual calculations.
What is a KPI?
A KPI (key performance indicator) is a measurable value that shows how effectively your business is achieving its most important goals. KPIs turn your business performance into specific numbers you can track, compare, and act on.
Think of KPIs like the vital signs a doctor uses to measure your health. Your blood pressure, cholesterol level, and BMI each tell part of your health story. In the same way, business KPIs like gross profit margin, accounts receivable days, and debt-to-equity ratio each reveal something specific. They tell you how your business is really performing.
Every business uses different KPIs based on what matters most. The key is choosing metrics that directly connect to your goals and help you make better decisions.
Why KPIs matter for your small business
KPIs help you make confident, data-driven decisions instead of relying on gut feelings. When you track the right metrics, you spot problems early and see opportunities before your competitors do.
Here's what KPIs can do for your business:
- Replace guesswork with data: base decisions on actual performance numbers, not assumptions
- Catch problems early: identify cash flow issues, declining sales, or rising costs before they become crises
- Track progress toward goals: measure whether you're moving closer to your targets
- Communicate clearly with stakeholders: show lenders, partners, or investors exactly how your business is performing
- Focus your team's efforts: help everyone understand what success looks like and what to prioritize
Just as a doctor combines multiple health indicators to understand your overall wellbeing, you need a set of KPIs working together. They give you the full picture of your business health.
Metrics vs KPIs: understanding the difference
All KPIs are metrics, but not all metrics are KPIs. A metric is any number you can measure about your business. A KPI is a specific metric that directly tracks progress toward a strategic goal.
Here's the difference in practice:
- Metric: total number of website visitors this month
- KPI: conversion rate of visitors to paying customers (if your goal is revenue growth)
- Metric: number of invoices sent
- KPI: accounts receivable days (if your goal is improving cash flow)
The distinction matters because tracking too many metrics wastes time. KPIs help you focus on the numbers that actually move your business forward.
Types of KPIs for small businesses
KPIs fall into four main categories that work together to give you a complete picture of your business performance. Most small businesses should track at least one KPI from each group.
Efficiency KPIs
Efficiency KPIs measure how well you use your resources. They help you find waste and improve productivity.
- Reduce waste in materials, time, or money
- Improve staff productivity and output
- Lower inventory holding costs by optimizing stock levels
Growth KPIs
Growth KPIs track how quickly your business is expanding. They show whether your revenue, customer base, and market share are moving in the right direction.
- Increase revenue through higher sales volume or prices
- Expand your customer base and market share
- Build business equity and long-term value
Health KPIs
Health KPIs monitor your financial stability. They tell you whether your business can meet its obligations and stay solvent.
- Balance debt and equity at sustainable levels
- Optimize inventory relative to what you owe suppliers
- Speed up how quickly you collect payments
Resilience KPIs
Resilience KPIs measure your ability to weather challenges. They show whether your business can survive downturns, unexpected costs, or slow periods.
- Reduce credit risk by managing debt wisely
- Improve profitability to cover interest and expenses
- Increase equity-to-asset ratios for financial security
Leading vs lagging KPIs
Beyond categories, KPIs also split into two types based on timing: leading indicators and lagging indicators. Understanding the difference helps you balance forward-looking action with backward-looking proof.
Leading KPIs predict future results. They measure activities or conditions that drive performance before the outcome shows up in your financials. For example, the number of sales proposals sent this month is a leading indicator of next month's revenue.
Lagging KPIs confirm what already happened. They measure outcomes after the fact, like quarterly revenue, gross profit margin, or customer churn rate. Lagging KPIs are easier to measure accurately, but by the time you see them, the result is already locked in.
Most small businesses benefit from tracking both. Leading KPIs give you time to adjust course, while lagging KPIs confirm whether your actions actually worked.
You can use modern accounting software analytics to track KPIs across all of these categories. And if that software is cloud based, you can keep an eye on your KPIs from anywhere and at any time.
What makes a good KPI?
A good KPI is one you can actually use to improve your business. Not every metric qualifies. The best KPIs follow the SMART framework: they're Specific, Measurable, Achievable, Relevant, and Time-bound.
Here's what that looks like in practice:
- Specific: clearly defined so everyone on your team knows exactly what's being measured
- Measurable: based on data you can reliably collect and track
- Achievable: realistic given your current resources and capabilities
- Relevant: directly connected to your most important business goals, with the information capable of making a real difference in your decisions
- Time-bound: tied to a specific timeframe so you can measure progress consistently
For example, "improve cash flow" is a goal, not a KPI. "Reduce accounts receivable days from 35 to 25 within six months" is a SMART KPI because it's specific, measurable, achievable, relevant, and time-bound.
Financial KPIs come from your accounting data. The U.S. Securities and Exchange Commission identifies four main financial statements: balance sheets, income statements, cash flow statements, and statements of shareholders' equity. Non-financial KPIs come from other sources, like your website analytics or customer feedback. Most small businesses benefit from tracking both types.
Common KPI examples for small businesses
Here are specific KPIs organized by category, along with formulas for the most widely used ones. Choose the KPIs that align with your business goals and industry.
Efficiency examples
Efficiency KPIs show whether you're getting the most out of your resources. These are especially useful if you're trying to reduce costs or speed up operations.
- Inventory turnover: how many times you sell and replace stock in a period. Formula: Cost of Goods Sold / Average Inventory. A higher number means you're selling through stock faster.
- Accounts receivable days: how long it takes customers to pay you. Formula: (Accounts Receivable / Total Credit Sales) x Number of Days. Lower is better for your cash flow.
- Operating expense ratio: operating costs as a percentage of revenue. Formula: Operating Expenses / Revenue. A lower ratio means more of each dollar earned goes toward profit.
For context, US small businesses waited an average of 27.9 days to be paid in Q4 2025, according to Xero Small Business Insights. If your accounts receivable days are consistently above that benchmark, it may be worth reviewing your invoicing terms or follow-up process.
Growth examples
Growth KPIs track whether your business is expanding. They help you understand what's driving revenue and whether your customer acquisition efforts are paying off.
- Month-over-month revenue growth: percentage increase in sales compared to last month. Formula: ((This Month's Revenue - Last Month's Revenue) / Last Month's Revenue) x 100.
- Customer acquisition cost: what you spend to gain each new customer. Formula: Total Sales and Marketing Costs / Number of New Customers Acquired.
- Average transaction value: typical amount customers spend per purchase. Formula: Total Revenue / Number of Transactions.
Health examples
Health KPIs reveal your financial stability. They're the numbers your accountant and lenders pay the most attention to.
- Gross profit margin: revenue minus cost of goods sold, as a percentage. Formula: ((Revenue - Cost of Goods Sold) / Revenue) x 100. This tells you how much you keep from each sale before overhead.
- Current ratio: current assets divided by current liabilities. Formula: Current Assets / Current Liabilities. A ratio above 1.0 means you can cover your short-term obligations.
- Debt-to-equity ratio: how much you owe compared to what you own. Formula: Total Liabilities / Shareholders' Equity. For instance, the SEC clarifies that a 2-to-1 ratio means the company has two dollars of debt for every one dollar shareholders have invested.
Resilience examples
Resilience KPIs measure your ability to handle tough times. They show whether you have enough buffer to survive slow months or unexpected expenses.
- Cash runway: how long you can operate with current cash reserves
- Interest coverage ratio: earnings available to pay interest expenses
- Quick ratio: liquid assets available to cover short-term obligations
Different industries prioritize different KPIs. A retail shop might focus on inventory turnover and average transaction value, while a professional services firm might track billable hours and client retention.
KPIs by department
Once you know which categories matter, it helps to organize KPIs by department so each part of your business tracks what's most relevant. Here are the most common KPIs by function.
Sales KPIs
Sales KPIs measure how effectively your team turns prospects into paying customers. They help you spot gaps in your sales process early.
- Conversion rate: the percentage of leads or prospects that become paying customers
- Average deal size: the typical revenue generated per closed sale
- Sales cycle length: how many days it takes from first contact to a closed deal
Marketing KPIs
Marketing KPIs show whether your marketing spend is generating results. They connect your campaigns to actual business outcomes.
- Customer acquisition cost: the total cost of acquiring a new customer through marketing and sales efforts
- Return on ad spend: the revenue generated for every dollar spent on advertising
- Website conversion rate: the percentage of website visitors who take a desired action, like making a purchase or requesting a quote
Finance KPIs
Finance KPIs give you a clear view of your business's financial health. These are the numbers your accountant and lenders care about most.
- Gross profit margin: the percentage of revenue left after subtracting the cost of goods sold
- Accounts receivable days: the average number of days it takes to collect payment from customers
- Current ratio: your ability to pay short-term obligations with short-term assets
Operations and HR KPIs
Operations and HR KPIs track how efficiently your business runs day to day. They highlight productivity gains or bottlenecks in your processes.
- Employee productivity: revenue generated per employee over a given period
- Employee turnover rate: the percentage of employees who leave within a specific timeframe
- Order fulfillment time: how long it takes from receiving an order to delivering the product or service
How to choose the right KPIs for your business
Start by identifying your most important financial goals, then select KPIs that directly measure progress toward those goals. The U.S. Small Business Administration recommends tracking financial performance as a core part of managing any small business. The right KPIs give you early confirmation of success or early warnings of problems.
Your accountant can help you choose KPIs based on:
- your industry and competitive landscape
- your business size and location
- your stage in the business lifecycle (startup vs. established)
- your short-term and long-term goals
- your unique circumstances and priorities
How many KPIs should you track?
Most small businesses do best with four to six KPIs. This gives you a clear picture without overwhelming you with data.
- New business: begin with three to four KPIs tied to your immediate priorities
- Growing business: expand to six to eight KPIs, possibly organized by department
- Established business: track eight to 12 KPIs with regular reviews to stay focused
Quality beats quantity when it comes to KPIs. Too many metrics complicate the picture and waste time. Focus on what truly moves your business forward.
How to implement and track your KPIs
Setting up KPI tracking turns your goals into a system you can manage. Follow these steps to start measuring what matters.
- Define your business goals: identify what you want to achieve in the next six to 12 months and make each goal specific and measurable.
- Select four to six KPIs that align with those goals: choose a mix across efficiency, growth, health, and resilience, and confirm you have access to the data you need.
- Set up tracking in your accounting software: use dashboards and reports to display your KPIs, automate data collection through bank feeds and integrations, and enable real-time updates so you always see current numbers.
- Establish target ranges or benchmarks: research industry standards for your KPIs, set realistic targets based on your current performance, and ask your accountant for guidance on appropriate goals.
- Schedule regular reviews: review most KPIs monthly to spot trends, check critical metrics weekly during growth phases, and conduct quarterly deep dives with your accountant.
- Share KPIs with your team: make KPIs visible and easy to understand, explain why each metric matters, and celebrate progress and address issues together.
Cloud-based accounting software like Xero lets you check your KPIs anytime, from any device, so you always know where your business stands.
Understanding what your KPIs tell you
KPIs are useful tools, but you need to interpret them in context. A single number rarely tells the whole story. The value of KPIs comes from understanding the patterns behind them.
Look beyond the surface:
- A sales dip might be seasonal, not a performance problem (people don't buy winter coats in summer)
- A drop in inventory turnover might be intentional (you stocked up during a supplier sale)
- A shift in any KPI might have a perfectly logical explanation, so look for the "why" before drawing conclusions
Avoid knee-jerk reactions:
- Resist drawing conclusions from a single bad month
- Look for trends over time, not single data points
- Consider external factors like economic conditions or market shifts
Real-world data shows why trends matter more than snapshots. US small business sales growth reached +4.1% year-over-year in the September quarter of 2025. It dropped to just +0.9% in the December quarter, according to Xero Small Business Insights. A business owner looking only at Q4 might panic. But the broader quarterly trend reveals a seasonal pattern, not a fundamental problem.
The best approach is to use your KPIs to ask better questions. Try asking yourself these questions when a KPI shifts.
- "Why did this metric change?"
- "Is this a problem or an expected variation?"
- "What action should you take, if any?"
Your accountant can help interpret what your KPIs are telling you and recommend appropriate next steps. The real goal is to use those numbers to make smarter decisions.
Track your KPIs easily with Xero
KPI tracking can be straightforward with the right tools. With Xero's cloud-based accounting software, you can turn KPI tracking into a simple part of running your business.
With Xero, you can:
- Track your most important KPIs in real time through customizable dashboards
- Automate data collection with bank feeds and app integrations
- Generate reports instantly without manual calculations
- Access your business performance data anytime, from any device
- Share insights securely with your accountant or team
Whether you're monitoring efficiency, growth, health, or resilience KPIs, Xero Analytics Plus gives you a clear view. You can see where your business stands and where it's heading. Get one month free and see how easy it is to stay on top of your business performance.
FAQs on KPIs for small businesses
Here are frequently asked questions small business owners have about KPIs.
What's the difference between a KPI and a regular business metric?
A metric becomes a KPI when it directly ties to a strategic goal you're actively pursuing. If you can't explain what decision a metric informs, it's probably just a metric, not a KPI.
How many KPIs should my small business track?
Four to six KPIs is a strong starting point for most small businesses. A useful trigger for adding one is when you face a recurring decision with no clear number to guide it; that gap signals a missing KPI.
What are some examples of KPIs for small businesses?
The best starting KPIs for most small businesses are gross profit margin, cash runway, accounts receivable days, and revenue growth rate. If you manage a team, add employee productivity. If you sell physical products, add inventory turnover.
How often should I review my KPIs?
Monthly is the best default cadence for most KPIs. If a major event hits your business or market, do an unscheduled review right away rather than waiting for the next cycle.
Can accounting software help me track KPIs automatically?
Yes. Cloud accounting software connects directly to your bank and pulls transaction data automatically. This means your KPIs update in real time without spreadsheets or manual calculations.
What are leading and lagging KPIs?
Leading KPIs predict future outcomes by measuring the activities that drive results, like the number of sales calls made or proposals sent. Lagging KPIs confirm what already happened, like quarterly revenue or annual profit margin. Tracking both gives you a balance of foresight and accountability, so you can adjust your strategy early and verify that your changes are working.
Disclaimer
Xero does not provide accounting, tax, business or legal advice. This guide has been provided for information purposes only. You should consult your own professional advisors for advice directly relating to your business or before taking action in relation to any of the content provided.
Get one month free
Sign up to any Xero plan, and we will give you the first month free.