Small business analytics software with Xero
Turn your data into clear, actionable insights! Use Xero’s business analytics software to monitor your financial health, dive deep into performance metrics, and plan for the future with confidence.
Analyze your financials the easy way
Xero helps make sense of your numbers with simple reporting tools and graphs to track every dollar.
See clear, accurate data every time
Your Xero dashboard software brings your headline data, like revenue, expenses, and gross margins, in near-real time.
Work towards your business goals
Easily track metrics to keep an eye on your progress and set new goals.
Collaborate with your financial advisor
Xero cloud-based software lets you discuss data and make plans in online meetings.
Xero analytics helps your small business
Xero’s data analytics simplifies the numbers for you.
Always know how your business is doing
Easily access information and insights so you’re ready for any future business decision.
Make better decisions, faster
Save precious hours each week and have confidence in your finances with clear, precise information.
Improve your operations every day
Become more efficient in your day-to-day operations and increase your productivity.
Turn raw data into trend insights
Xero’s financial analytics software shows you data trends, so you can spend less time analyzing and more time doing!
- Customize your Xero dashboards to track your most important metrics
- Include operational data, like store visits or website traffic, alongside sales to get the full picture
- See graphs and data visualizations to spot patterns in your revenue and expenses – and make better business decisions

Keep your business on track
Xero highlights what's working and what needs your attention to keep your business moving in the right direction.
- Check your business health at a glance with Xero’s instant score indicators
- Dive deeper into what's driving results – from sales to operational efficiency – with detailed graphs and info
- Benchmark your performance to industry peers to make market-informed decisions (coming soon)

Plan your next steps with confidence
Xero’s predictive analytics tools help you plan ahead. Project your cash position to spot and fix any gaps. Scenario-plan the ‘what-ifs’ of cash in and cash out, like investing in new equipment. And visualize how different decisions affect your future position before you commit.
- Quickly get to grips with Xero’s user-friendly analytics tools
- See how upcoming quotes, invoices, and bills will affect your bank balance
- Export and share clear visuals so your advisor or team can weigh in on key decisions and milestones

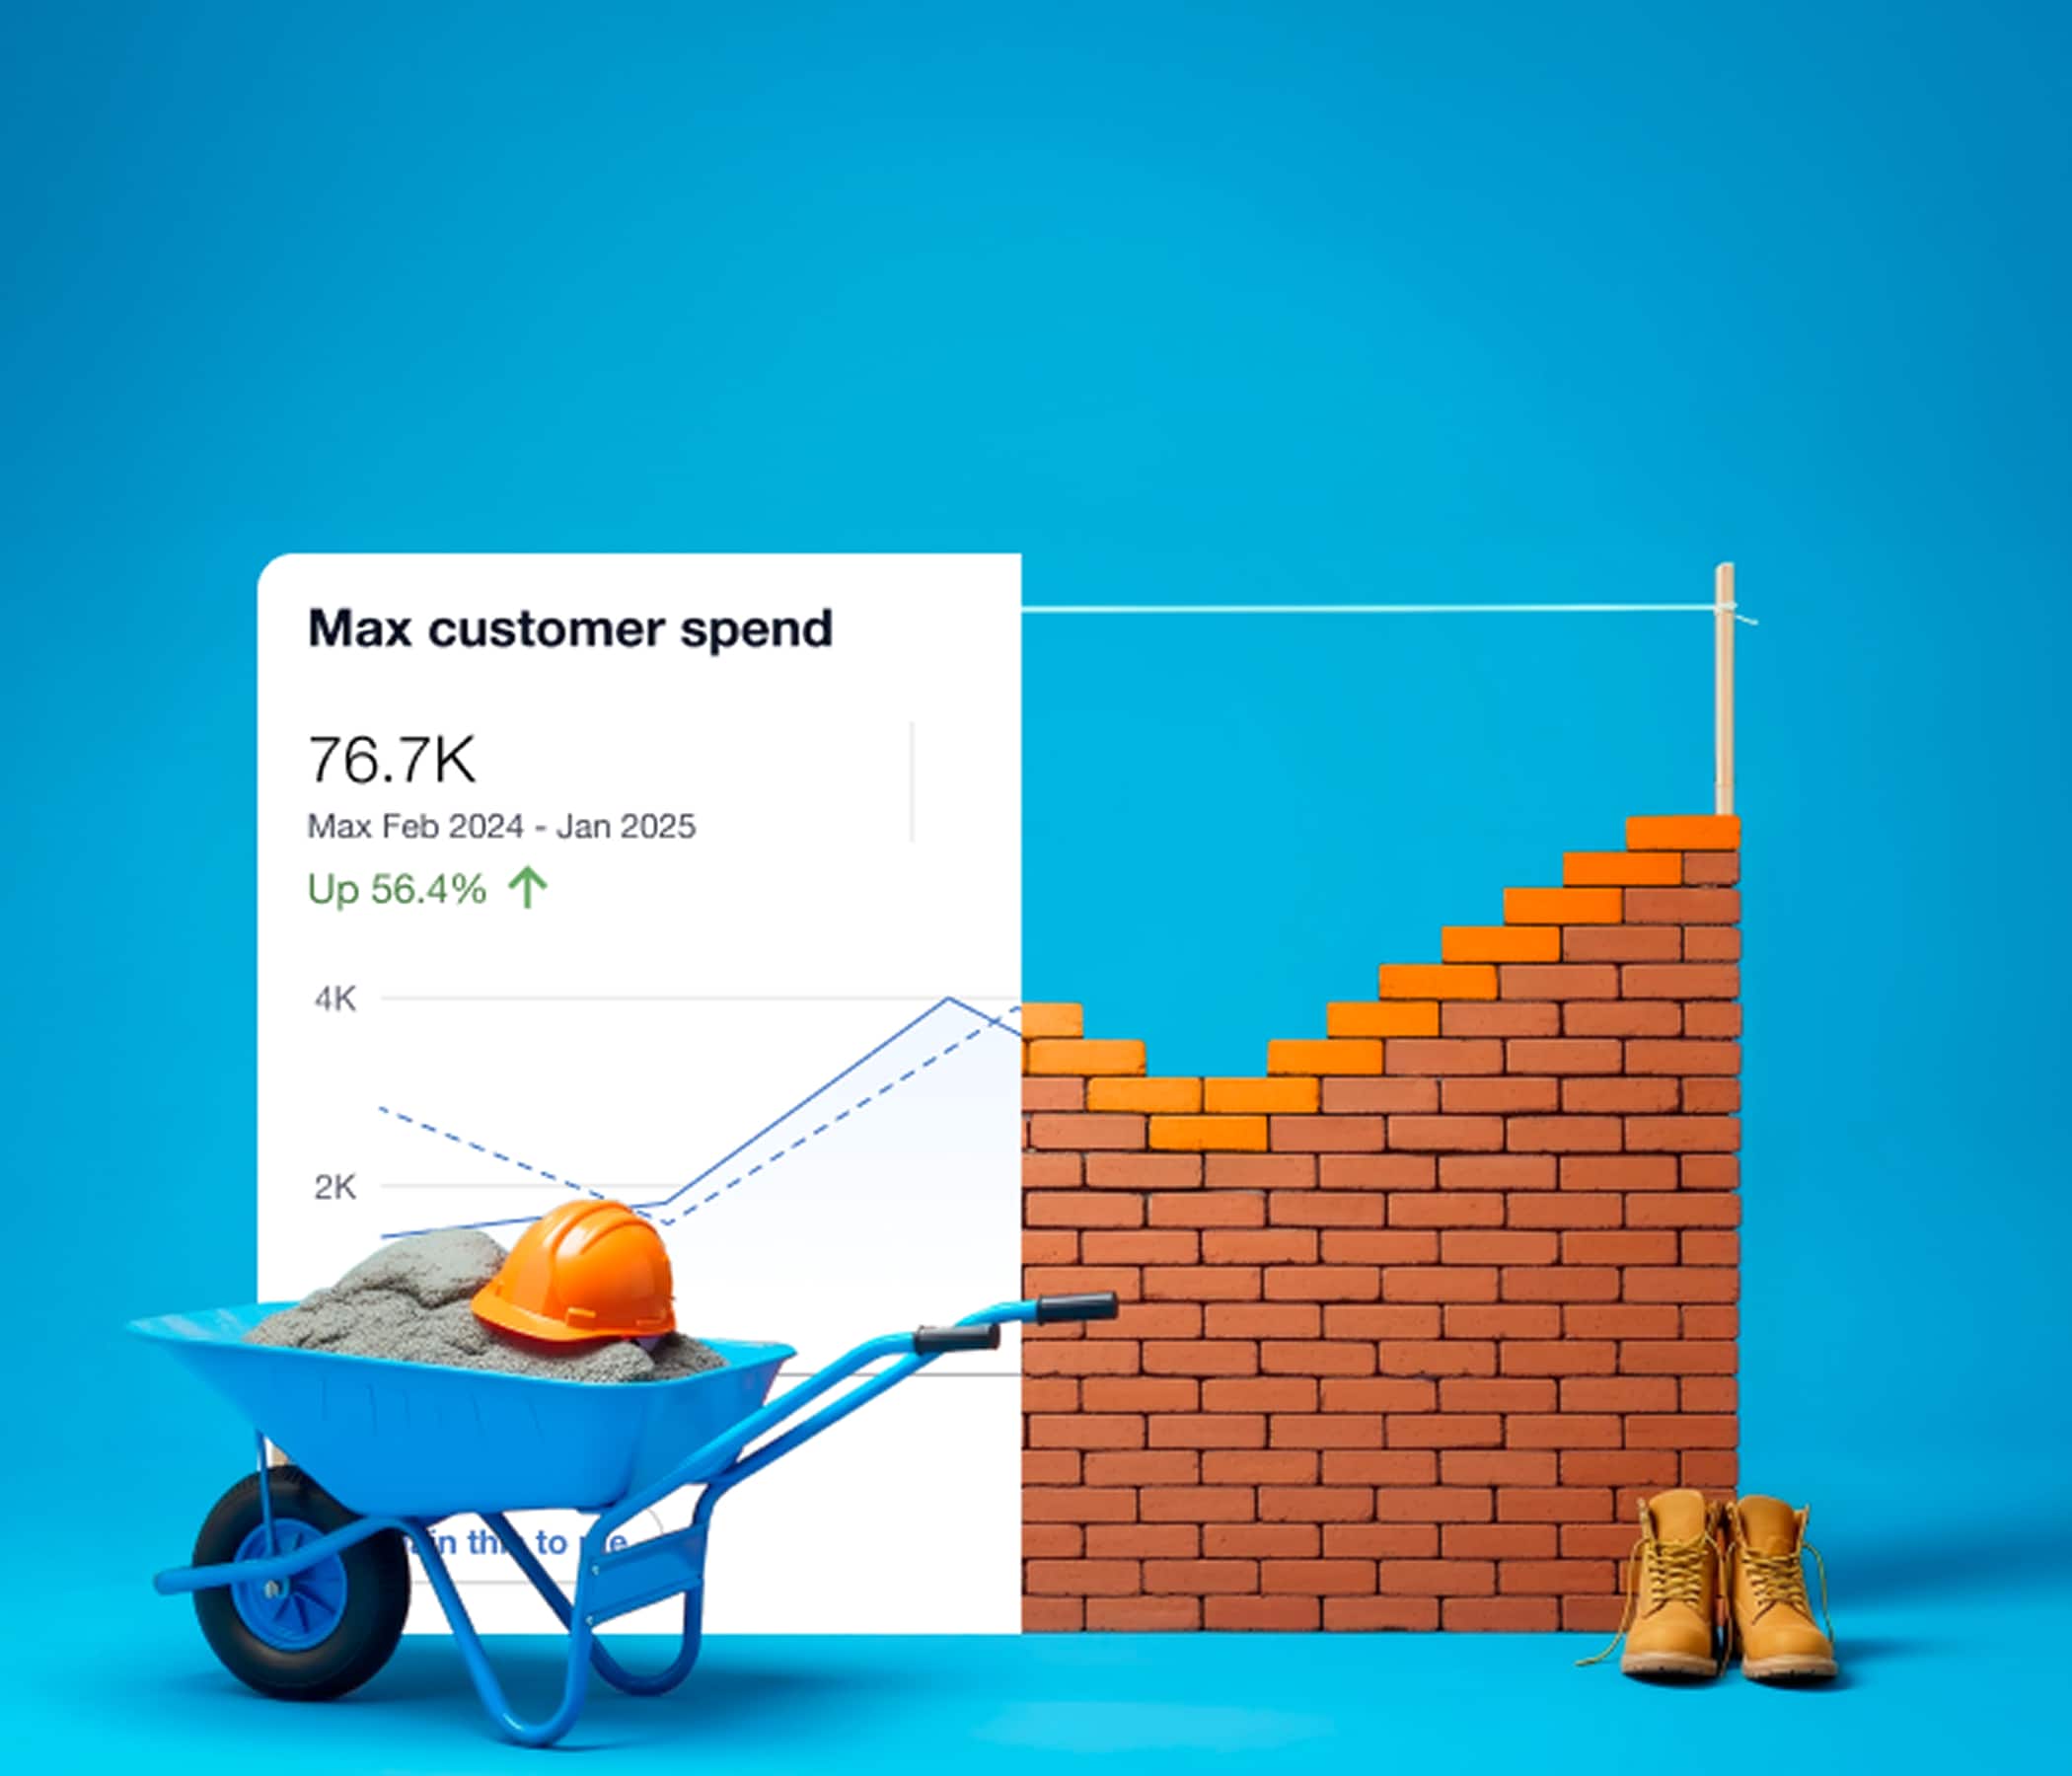
Building your business starts with the numbers
Maybe you’re reporting to the IRS, or analyzing last quarter’s revenue. Whatever the job, Xero turns complex data into simple, actionable insights.
Learn more about Xero cloud-based software
These new analytics features from Xero are exactly what I've been looking for. Instead of searching for another tool, I can now get the clear financial understanding I need, right within Xero. I'm looking forward to using these insights to feel more confidence in my business decisions.
Macushla Collins (The BD Edge)
FAQs on Xero business analytics software
Xero’s analytics tools help you make sense of large amounts of information that your business collects over time. Xero’s financial data analytics software helps you keep your business performance top of mind and shows you areas for improvement.
Xero’s analytics tools help you make sense of large amounts of information that your business collects over time. Xero’s financial data analytics software helps you keep your business performance top of mind and shows you areas for improvement.
Xero’s analytic tools help you analyze your data to better understand what’s happening in your business. The business analytics software helps you identify which time of year is most profitable, and when you need cash reserves. Use the info to predict what’s coming up and to plan ahead.
Xero’s analytic tools help you analyze your data to better understand what’s happening in your business. The business analytics software helps you identify which time of year is most profitable, and when you need cash reserves. Use the info to predict what’s coming up and to plan ahead.
Xero Analytics provides you with access to a number of features from visualisations and cash flow forecasting through to KPI analysis and benchmarking (coming soon).
Access to some functionality - such as customisations and extended short-term cash flow forecasting - varies by plan. Please refer to the Xero pricing plans page to see which features are available across these plans.
Yes – you can give access to anyone in your team with Standard plus Reporting or the Advisor user permission directly within your Xero account. Once you’ve logged in to Xero, you’ll find these features under the Reporting tab.
Yes – you can give access to anyone in your team with Standard plus Reporting or the Advisor user permission directly within your Xero account. Once you’ve logged in to Xero, you’ll find these features under the Reporting tab.
Start using Xero Analytics for free
Start tracking your business health with Xero Analytics. Available in all business plans at no cost.