United States Small Business Insights
This analysis focuses on core performance metrics of sales growth, late payments and time to be paid.

Sales growth up slightly as payment wait times lengthen
Published: 30 July 2026
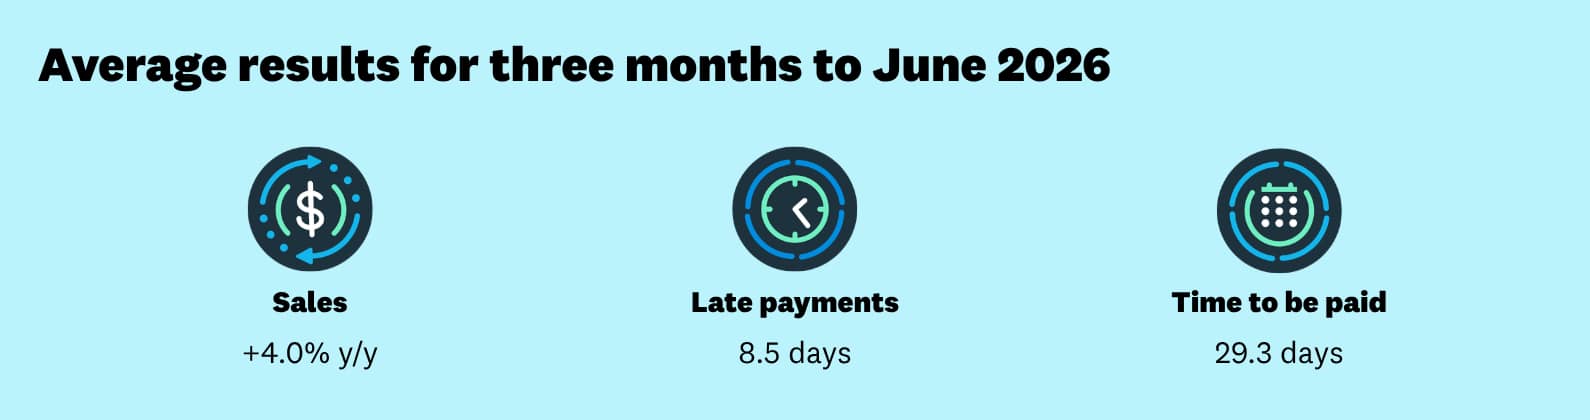
According to the latest Xero Small Business Insights (XSBI) data, US small business sales grew 4.0% year-over-year in the June quarter. This was the second consecutive quarter showing improving, albeit still modest, sales growth. New state-level XSBI data shows the best performing states were the grouping of Maryland, Virginia and the District of Columbia, New York and Delaware. Payment metrics were mixed as late payments fell 0.5 days, to 8.5 days, but the length of time small businesses waited to be paid increased 0.7 days to 29.3 days, likely indicating longer invoice payment terms. Overall, this result suggests ongoing higher-than-usual gasoline prices, due to the Middle East conflict, continue to constrain consumer spending, squeeze profit margins and put pressure on cash flows.
Small business sales rose 4.0% year-over-year (y/y) in the June quarter. This reflects a gradual improvement from 3.5% y/y in the March quarter and 2.1% y/y in the December quarter. Nevertheless sales growth could likely have been stronger if not for the conflict in the Middle East and remains below the 5.4% y/y long-term average.
The monthly data illustrates how rising gasoline prices have stretched household budgets and potentially crimped small business sales over the quarter. Gasoline prices began to climb in March, crossing the $4.00 per gallon mark nationwide for the first time since 2022. This didn't have an immediate impact on small business sales, which rose a near-historical average 5.2% y/y in March. However, gasoline prices continued to increase over the following weeks, peaking in May. This prolonged period of higher-than-normal prices, and the flow-on effects to the price of other goods, meant households started diverting spending away from small businesses in order to fill up their cars and pay for other essentials. Sales growth slowed to 4.6% y/y in April and then to just 2.6% y/y in May. Hope for a ceasefire in June, even a temporary one, saw retail gasoline prices dip slightly. This freed up some capacity for spending and small business sales picked up again, growing 4.8% y/y in June.
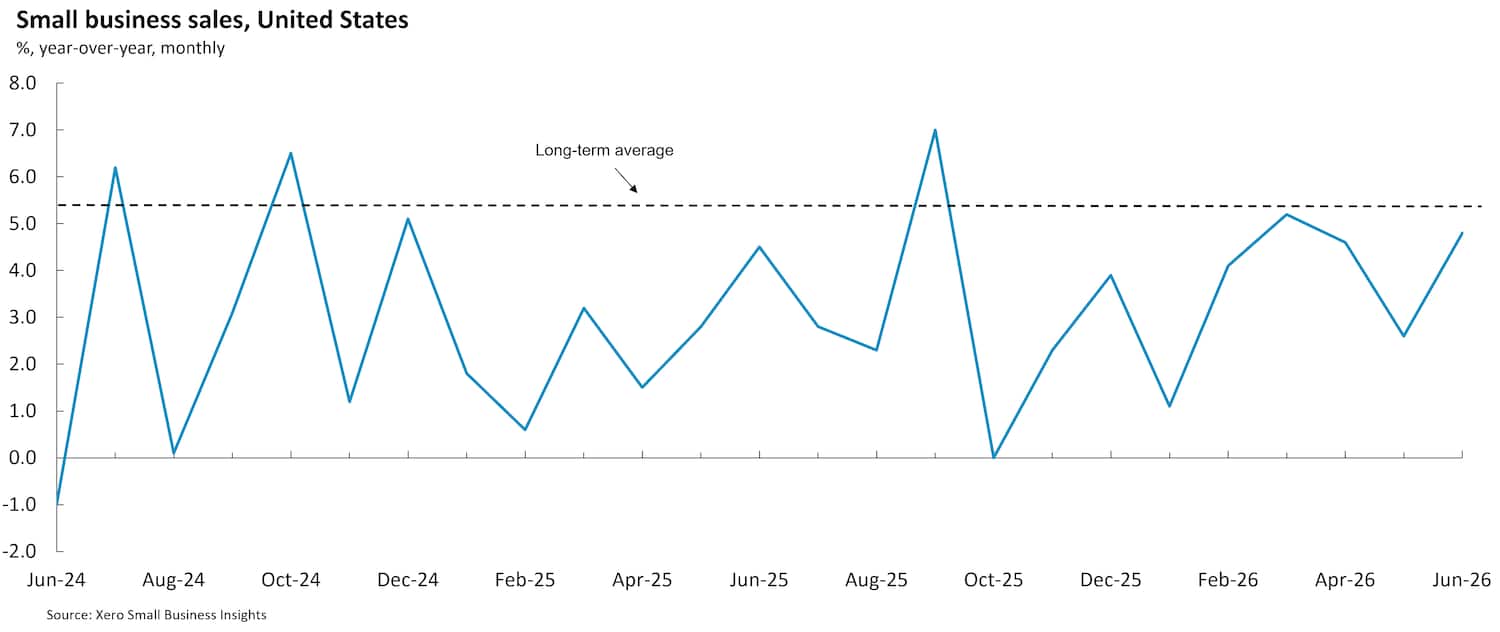
Sales growth could likely have been stronger if not for the conflict in the Middle East and remains below the 5.4% y/y long-term average.
XSBI US April 2026 - June 2026 data
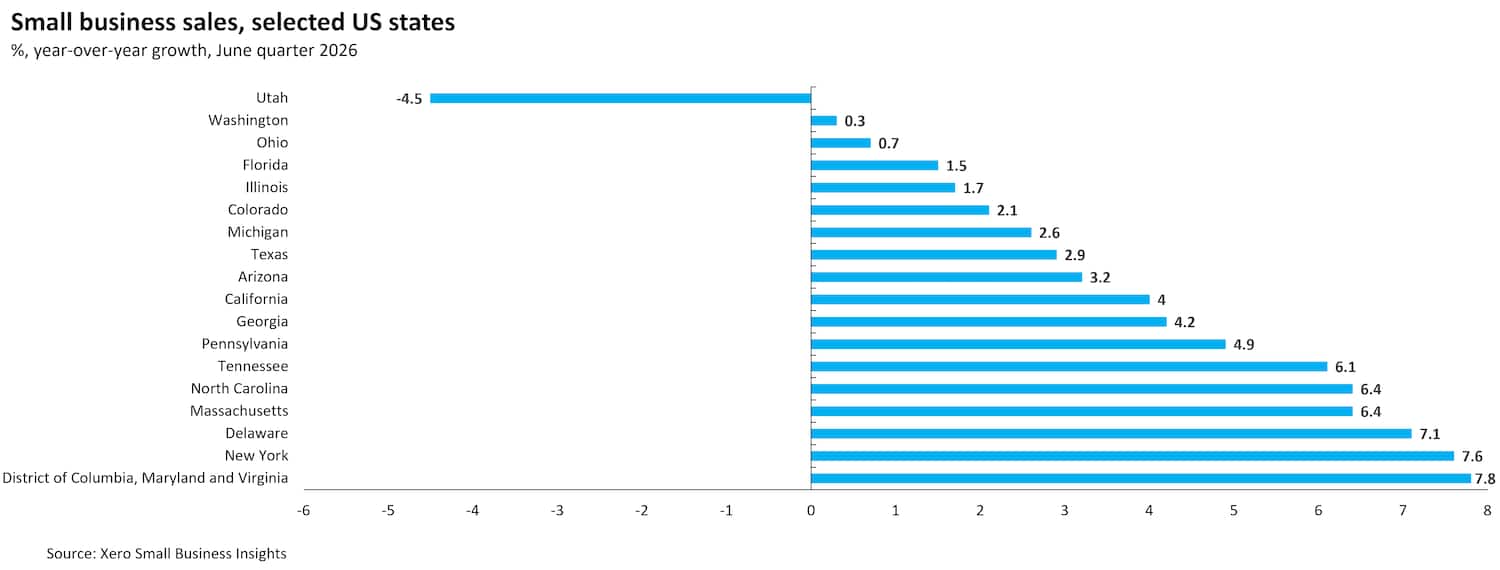
For the first time XSBI data includes new state-level data for 17 states and the combined region of Maryland, Virginia and the District of Columbia. This data, which is available back to January 2019, shows considerable differences in performance between the states. In the June quarter, sales growth was led by the grouping of Maryland, Virginia and the District of Columbia (+7.8% y/y), New York (+7.6% y/y) and Delaware (+7.1% y/y). In contrast, sales fell during the quarter in Utah (-4.5% y/y) and were only just higher than a year ago in Washington (+0.3% y/y) and Ohio (+0.7% y/y). The Utah result stands out because it is different from the rest of the country, different from Utah's usual performance and all three months of the quarter recorded lower sales than a year ago. We will be closely tracking this state in the coming months to see if this softness is temporary.
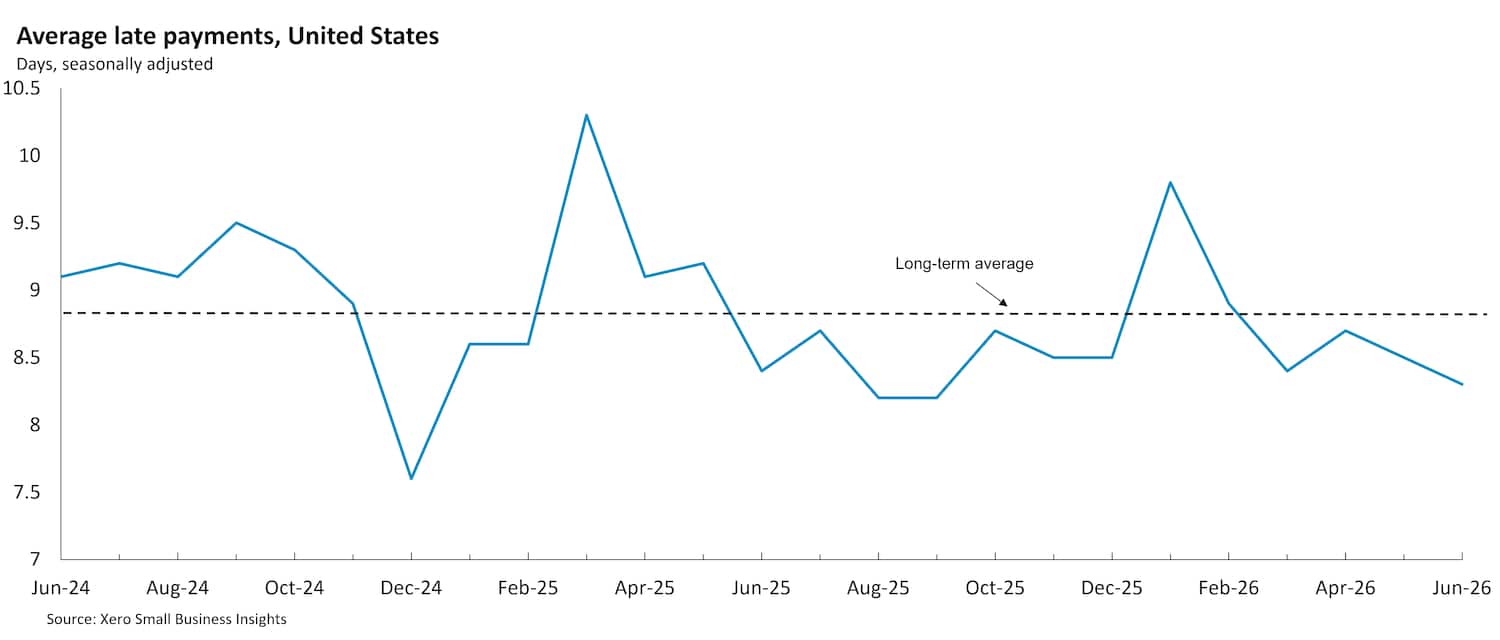
Small business payment times were mixed in the June quarter. Late payment times improved 0.5 days to 8.5 days. There was gradual improvement during the quarter - 8.7 days in April, 8.5 days in May and 8.3 days in June.
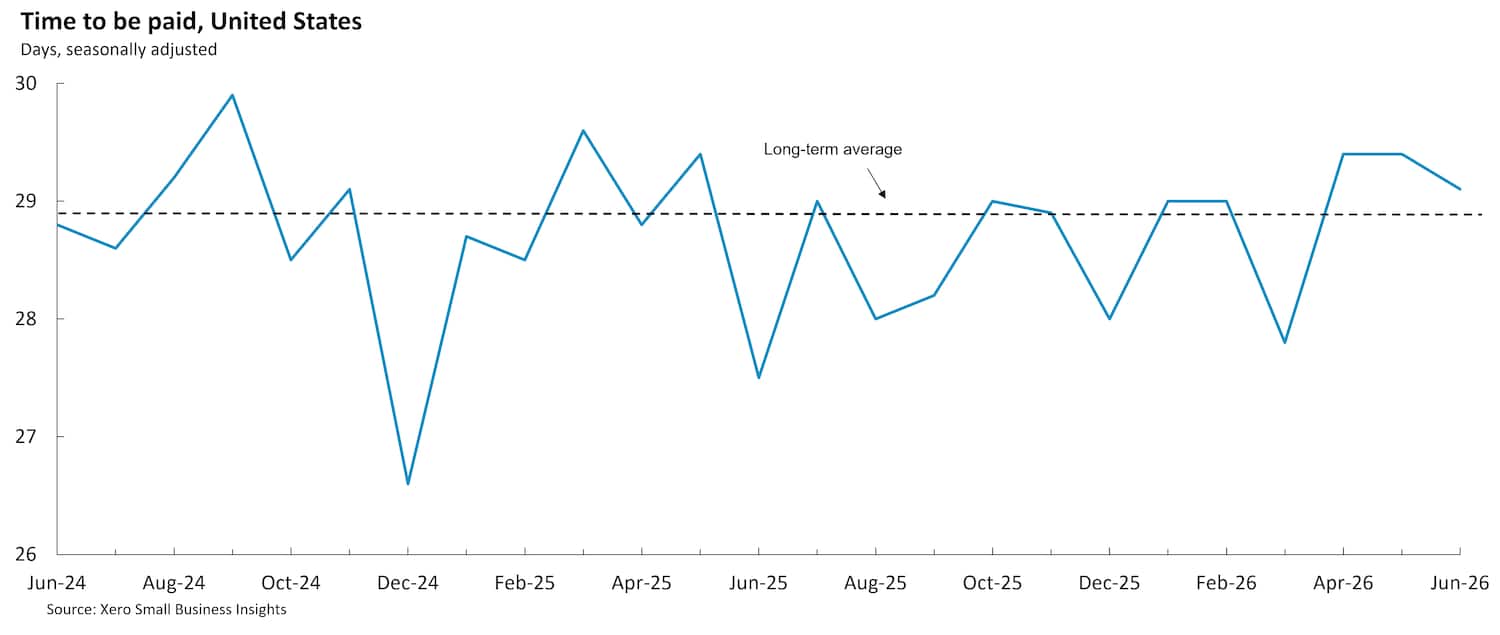
However, the length of time small businesses had to wait to be paid moved in the other direction. This suggests small businesses, on average, extended the payment terms of their invoices. Small businesses had to wait, on average, 29.3 days for their invoices to be paid, up from 28.6 days in the March quarter. This measure was better than its historical average (28.9 days) for only one of the first six months of the year.
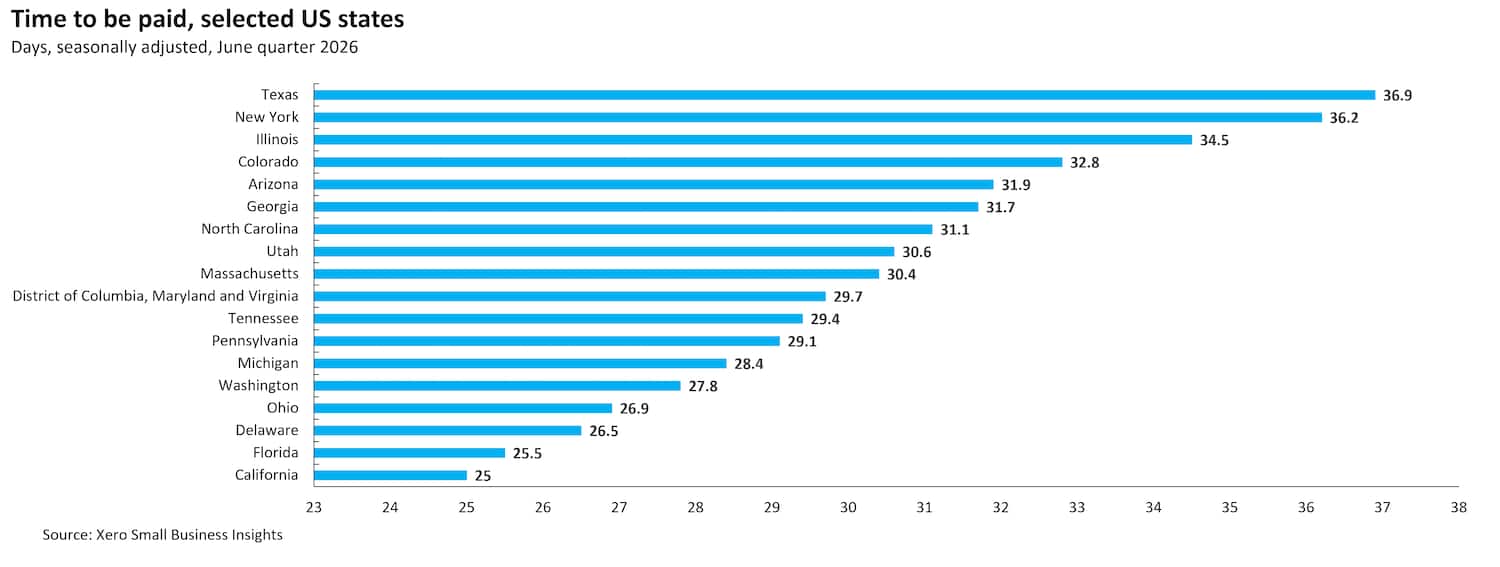
Payment time data is also now available for selected US states and the grouping of Maryland, Virginia and the District of Columbia. As with the sales results, there is a lot of variation between states, with the fastest paying jurisdiction (California) having small businesses that are paid, on average, 11.9 days quicker than their counterparts in Texas.
Overall, the XSBI data shows that while US small business sales grew in the early months of the year, the rise was smaller than the historical average. The monthly pattern, especially the soft result in May, suggests the rise in gasoline prices meant sales growth was smaller than it could have been without the conflict in the Middle East.
Looking ahead, US small businesses are likely to face ongoing macro challenges over the rest of 2026, as the flow-on effects of the Middle East conflict continue to dominate US, and global, economic trends. Various ceasefire agreements have been unable to hold for more than a few weeks, which has prevented global oil, natural gas and fertilizer markets returning to normal operations. The world is adjusting, including buying more oil from the US, but gasoline prices remain elevated compared to where they were at the start of the year. The importance of gasoline in many goods supply-chains means the risk of flow-on effects to other prices remains elevated and recent CPI reports suggest some pass-through is already underway in the US. The OECD expects the US economy to grow 2.0% in 2026, similar to the result for 2025. This forecast is underpinned by two opposing forces. While the Middle East conflict is hurting household spending, this is being more than offset in the US by accelerated AI-related business investment spending. However, this AI investment is mainly being done by large businesses. The negative impact of the Middle East conflict on household spending is likely to be the more dominant force when it comes to the outlook for small business sales. In addition, profit margins and cash flow will continue to be under-pressure as US small businesses are squeezed between rising input costs (including, and beyond, gasoline) and increasingly hesitant customers.
For more information on the XSBI metrics, see our methodology page.

Disclaimer
This report was prepared using Xero Small Business Insights data and publicly available data for the purpose of informing and developing policies to support small businesses.
This report includes and is in parts based on assumptions or estimates. It contains general information only and should not be taken as taxation, financial, investment or legal advice. Xero recommends that readers always obtain specific and detailed professional advice about any business decision.
The insights in this report were created from the data that was available as at the date it was extracted. Data used was anonymised and aggregated to ensure individual businesses can not be identified.
Find out more about XSBI
If you have any questions about Xero Small Business Insights, reach out to us.