Key performance indicators: Measure and improve your business
Learn how key performance indicators guide smart decisions and help you track growth, profit, and cash flow.
Written by Lena Hanna—Trusted CPA Guidance on Accounting and Tax. Read Lena's full bio
Published Friday 30 January 2026
Table of contents
Key takeaways
- Focus on tracking 5-8 carefully selected KPIs that directly impact your business decisions rather than overwhelming yourself with too many metrics, as quality beats quantity when it comes to meaningful measurement.
- Choose a balanced mix of leading indicators that predict future performance and lagging indicators that measure past results to get both early warning signs and confirmation of success.
- Interpret your KPI data within proper context by considering seasonal variations, recent business decisions, and industry factors rather than taking metrics at face value.
- Organise your KPIs into four key groups - efficiency, growth, health, and resilience - to ensure you're measuring all critical aspects of your business performance and can identify specific areas for improvement.
What are key performance indicators?
Key performance indicators (KPIs) are measurable values that show how well your business is performing against its goals. They turn raw business data into useful insights that help you make better decisions.
Just like doctors use body mass index (BMI), blood pressure and cholesterol to measure health, businesses use specific metrics to track performance. Financial KPIs like debt/equity ratio and gross profit percentage reveal your business’s financial health.
Business KPIs are used by companies of all sizes. Each business will track different metrics, but the core purpose remains the same: measuring what matters most to your success.
Why KPIs matter for small businesses
For a small business, tracking the right KPIs is crucial. It helps you move from guessing to knowing. Instead of just hoping for growth, you can measure it, understand what drives it, and make plans to achieve more of it.
KPIs help you to:
- stay focused on your most important goals
- spot potential problems before they become serious
- make informed decisions based on real data
- keep your team aligned and motivated
- celebrate your successes and build momentum
Types of KPIs
KPIs come in different forms, and understanding the types can help you choose the best ones for your business. Most KPIs fall into a few main categories.
- Leading vs Lagging: Leading indicators predict future performance (like website traffic), while lagging indicators measure past results (like total sales for last quarter). A good strategy uses a mix of both.
- Strategic vs Operational: Strategic KPIs track progress towards big-picture goals, like market share. Operational KPIs measure the performance of day-to-day activities, like order processing time.
- Financial vs Non-Financial: Financial KPIs, like net profit margin, are about money. Non-financial KPIs, like customer satisfaction scores, measure other critical aspects of your business, such as workplace culture. For example, after focusing on this area, one company was rated 8th out of 700,000 companies on Glassdoor for its culture.
Common KPI examples for small businesses
The KPIs you choose will depend on your industry and goals, but some are common across many small businesses. Here are a few examples to get you started.
Financial KPIs
- Gross profit margin: shows the percentage of revenue left after subtracting the cost of goods sold
- Net profit margin: reveals what percentage of revenue is left after all expenses have been paid
- Cash flow: tracks the movement of money in and out of your business
Sales KPIs
- Customer acquisition cost (CAC): the average cost to gain a new customer
- Customer lifetime value (CLV): the total revenue you can expect from a single customer account
Choose what you measure with care
Choosing the right KPIs requires careful consideration of your business context. Focus on metrics that provide early warning signs of problems or confirm success.
Your accountant can help you select the most relevant KPIs by considering:
- industry type: different sectors require different metrics
- business size: small businesses need simpler tracking than large corporations
- business lifecycle: startups focus on growth, while mature businesses track efficiency
- goals: short and long-term objectives determine which metrics matter
- circumstances: your unique situation influences what you should measure
What does a KPI look like?
A KPI is a metric that measures specific aspects of your business performance. Effective KPIs share four key characteristics:
- Relevant: Focus on metrics that directly impact your business success
- Balanced: Track both short-term performance and long-term trends
- Understandable: Everyone in your business should know what each KPI means
- Shared: Your team should understand why each metric matters
KPI data sources fall into two categories. Financial KPIs come from your accounting system, while non-financial KPIs come from other sources like your website or CRM system. This guide focuses on financial KPIs.
Here are examples of what you might measure:
- Debtor days
- Average margins
- Debt ratio
- Net profit percentage
Identify the key areas you want to measure
Focus on what matters most when selecting KPIs. Only measure things that will genuinely impact your business decisions and outcomes.
How many KPIs should you track? Small businesses typically need five to eight KPIs, a range supported by research from PricewaterhouseCoopers (PwC), which suggests that between four and ten measures are key for most companies. Larger organisations might track that many per department.
Quality beats quantity when it comes to KPIs. Too many metrics create confusion rather than clarity. Choose just enough to give you a complete picture of your business performance.
Understand what your metrics are telling you
Interpret KPIs in context rather than taking them at face value. Understanding why metrics change is as important as tracking the changes themselves.
Seasonal variations can explain many metric changes. A winter clothing retailer will naturally see sales dip in summer, and this change can still be consistent with a healthy business.
Business decisions can also affect KPIs temporarily. If you bought extra inventory during a supplier sale, your inventory turnover might drop. This can still be a good decision if you monitor the metric until inventory levels normalise.
Context is crucial when interpreting KPIs. Your accountant can help you understand what your metrics really mean and when action is needed.
Four KPI groups to improve your business
Four KPI groups can transform your business performance. Each group focuses on a different aspect of business health:
1. Efficiency KPIs
- Resource optimisation: Reduce waste and maximise productivity
- Staff performance: Track and improve employee productivity
- Inventory management: Lower storage costs by reducing inventory days
2. Growth KPIs
- Revenue tracking: Monitor gross and net revenue increases. One company, for example, tracked its performance against a target of gross domestic product (GDP) +1%, reporting that its box volumes grew 5.2 per cent consistently for a year.
- Wealth building: Measure business equity growth over time
3. Health KPIs
- Financial balance: Optimise debt and equity proportions
- Cash flow: Balance inventory with trade payables for better performance
- Payment terms: Speed up customer receipts through better terms
4. Resilience KPIs
- Credit management: Reduce risk by optimising debt levels
- Profitability: Improve interest coverage through better margins
- Financial stability: Increase equity-to-asset ratios for stronger foundations
These are just examples. No doubt you can think of others that might apply to your particular business.
You can use modern accounting software analytics to track some of these KPI groups. If that software is cloud-based, you can keep an eye on your KPIs from anywhere, at any time.
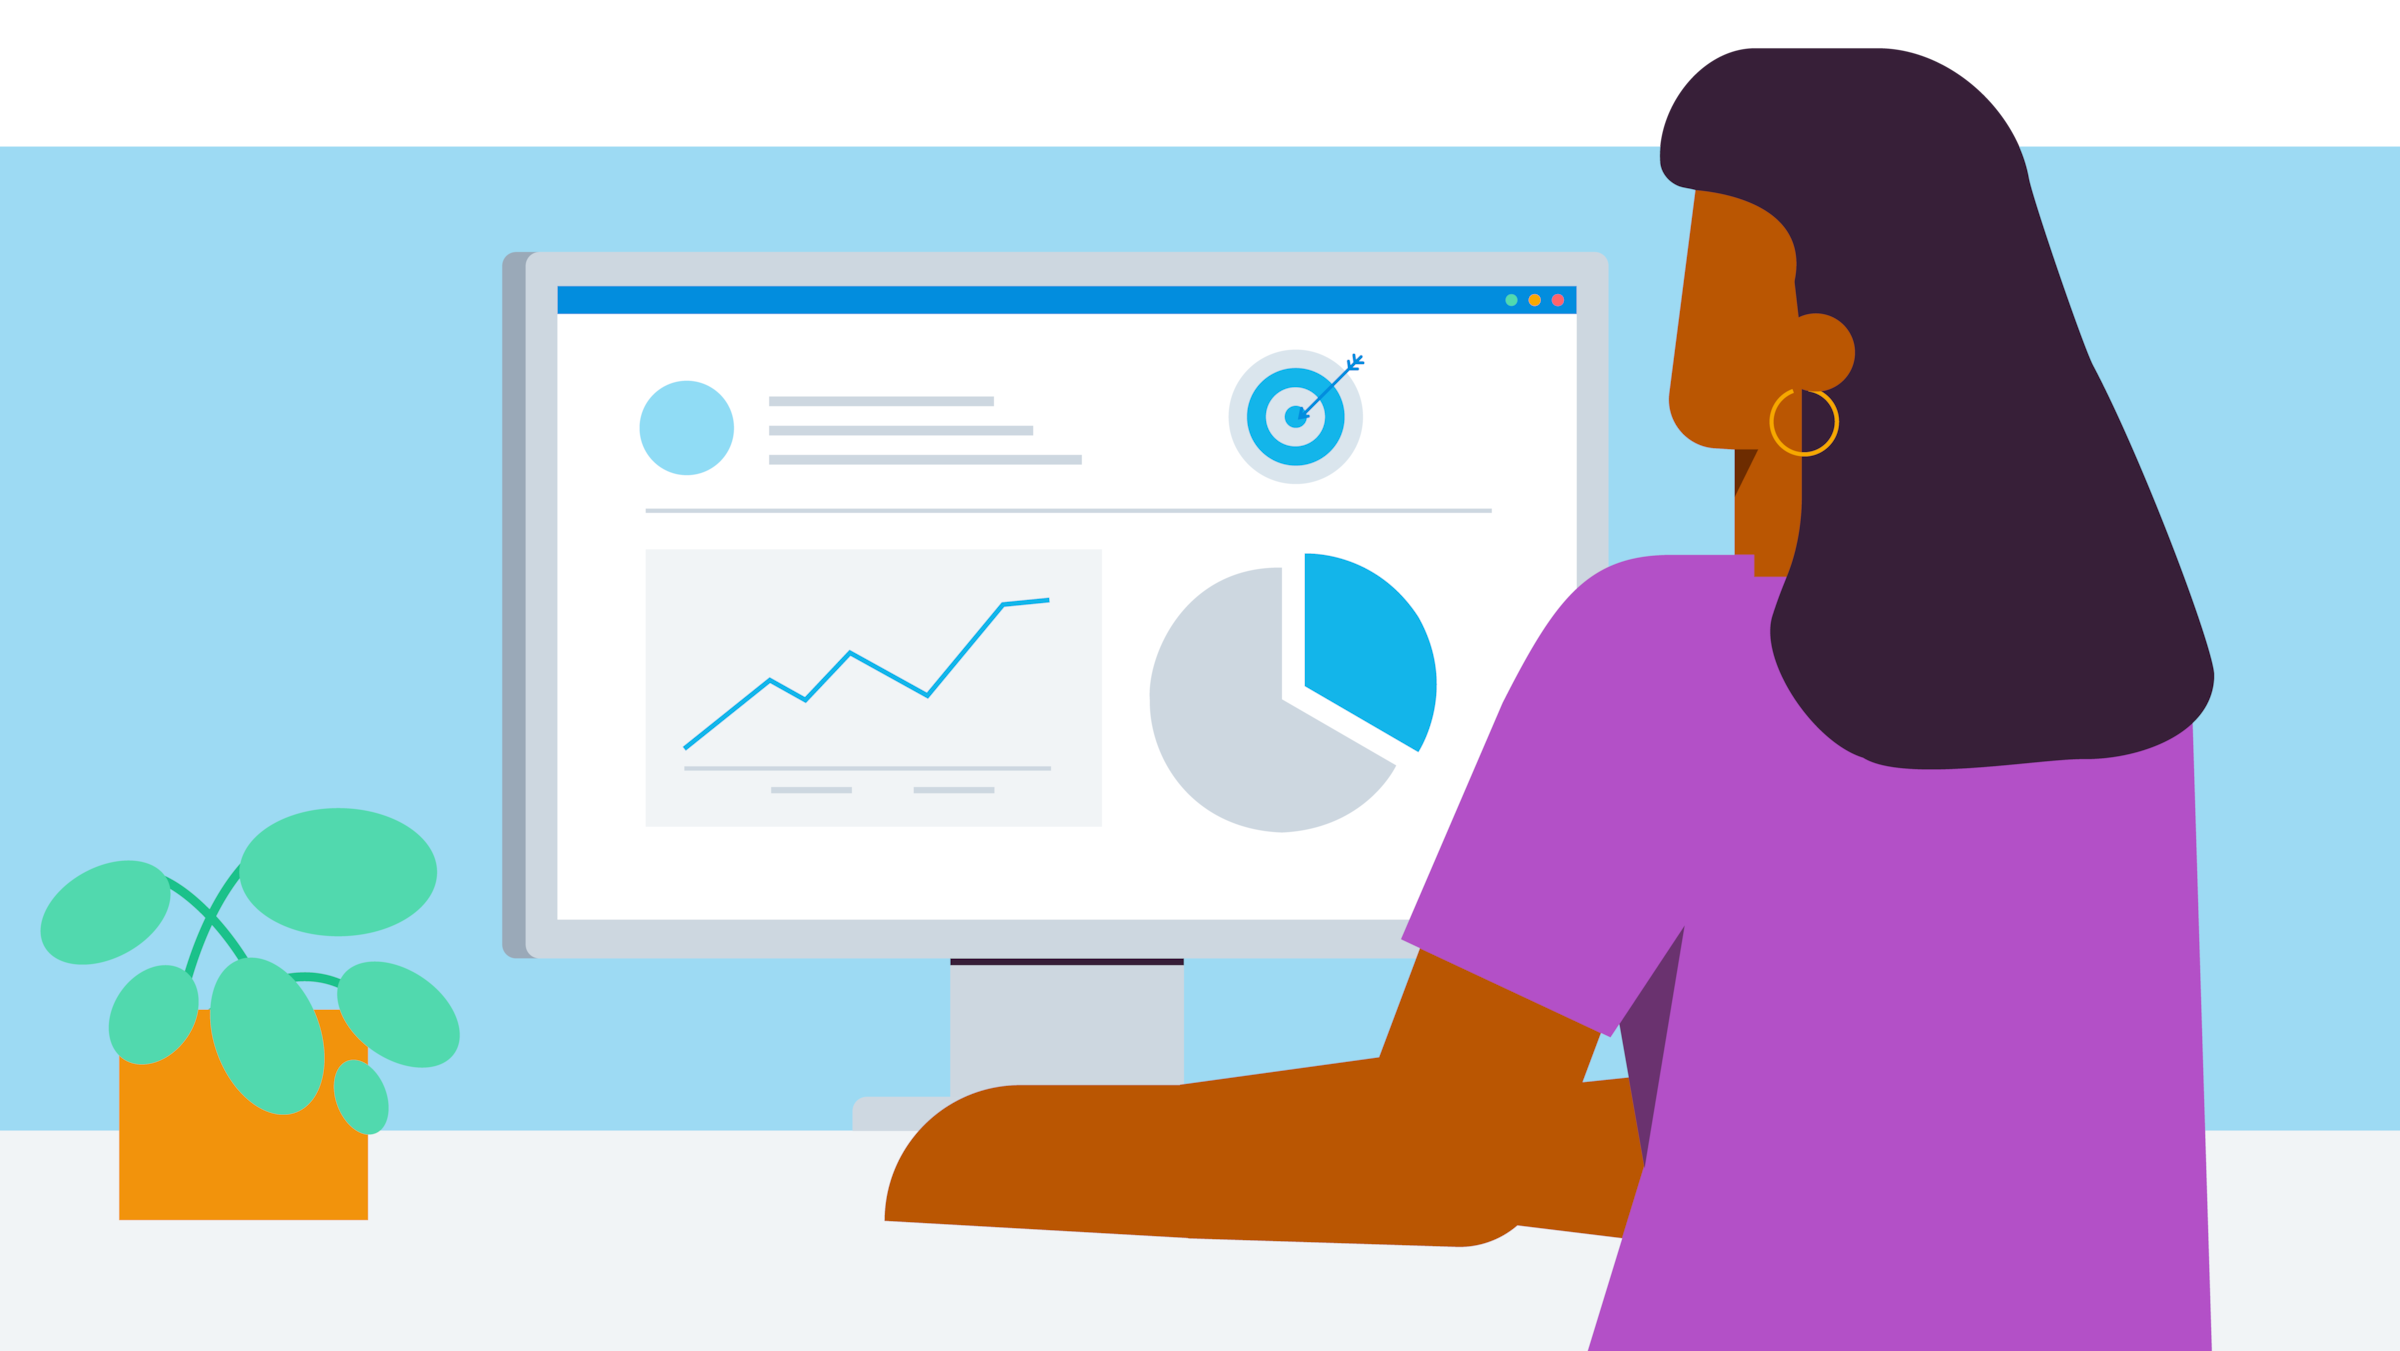
How to track KPIs with accounting software
KPIs transform business decision-making when used consistently. Don’t just set them up and forget them; regular review and tracking are essential for success.
Regular monitoring helps you spot trends early and take corrective action when needed. This gives you a clear view of your current performance and future direction.
Track your KPIs effectively with modern accounting software that automates data collection and provides real-time insights. Try Xero for free to see how cloud-based analytics can simplify your KPI tracking and give you the business insights you need to succeed.
FAQs on key performance indicators
Here are answers to some common questions about key performance indicators.
What are five examples of key performance indicators?
Five common examples for a small business are: gross profit margin, net profit margin, customer acquisition cost (CAC), customer lifetime value (CLV), and monthly recurring revenue (MRR). The best ones for you depend on your specific business goals.
How is a KPI calculated?
A KPI is calculated using a specific formula. For example, to calculate your gross profit margin, you would use the formula: (Total Revenue - Cost of Goods Sold) / Total Revenue. The result is then multiplied by 100 to get a percentage.
What are three essential KPIs for a small business?
While it varies, three essential KPIs for most small businesses are cash flow, net profit margin, and customer satisfaction. These give you a balanced view of your financial health, profitability, and relationship with your customers.
Disclaimer
Xero does not provide accounting, tax, business or legal advice. This guide has been provided for information purposes only. You should consult your own professional advisors for advice directly relating to your business or before taking action in relation to any of the content provided.
Start using Xero for free
Access Xero features for 30 days, then decide which plan best suits your business.