Current ratio explained: formula, examples and how to use it
Learn how to calculate, interpret, and track your current ratio to stay on top of short-term liquidity.
Written by Jotika Teli—Certified Public Accountant with 24 years of experience. Read Jotika's full bio
Published Monday 11 May 2026
Table of contents
Key takeaways
- Calculate your current ratio monthly by dividing current assets by current liabilities to track whether your business can cover short-term debts and obligations
- Aim for a current ratio between 1.2 and 2.0, as this signals healthy liquidity without tying up excess cash that could fuel business growth
- Combine your current ratio with cash flow forecasts and other liquidity measures like the quick ratio to get a fuller picture of your financial health
- A ratio below 1.0 may signal payment difficulties, while a ratio consistently above 3.0 could mean you're holding too much idle cash
Current ratio definition
The current ratio is a financial metric that measures your business's ability to pay its short-term debts using its short-term assets. It's one of the most widely used liquidity ratios in business finance.
You might also hear it called the working capital ratio. Both terms describe the same calculation: current assets divided by current liabilities. The result tells you whether your business has enough resources to cover bills, loan repayments, and other obligations due within 12 months.
The current ratio gives you a broader view of liquidity than the quick ratio, because it includes all current assets, not just those you can convert to cash within 90 days. That means it factors in inventory and prepaid expenses too. You can find more context on this measure in this ACCA resource.
A healthy current ratio signals that your business can meet its near-term obligations without scrambling for funds. A weak one suggests you may need to rethink your cash position.
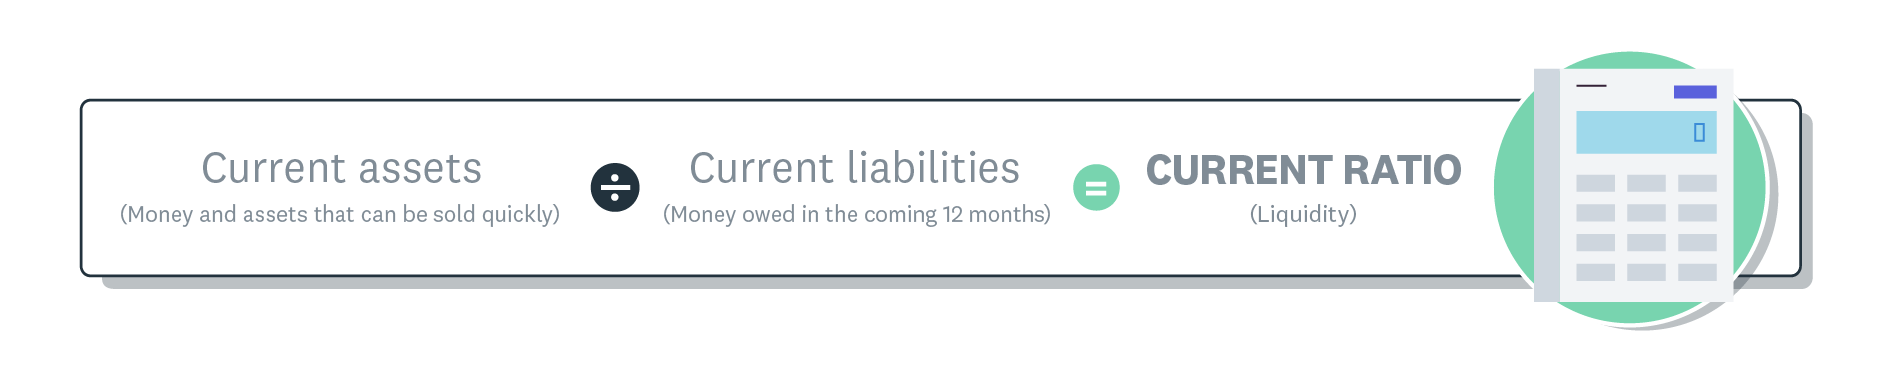
Current ratio liquidity formula.
Current ratio formula
The formula for calculating your current ratio is straightforward. You divide your total current assets by your total current liabilities.
Current ratio = Current assets ÷ Current liabilities
Both figures sit on your balance sheet. Accounting software like Xero pulls these numbers together automatically, so you don't need to calculate them by hand. Here's what each side of the equation includes.
What are current assets?
Current assets are resources your business expects to use or convert into cash within 12 months. Common examples include:
- Cash and cash equivalents
- Accounts receivable
- Inventory
- Prepaid expenses
- Short-term investments
Now let's look at the other side of the equation.
What are current liabilities?
Current liabilities are obligations your business must settle within 12 months. Common examples include:
- Accounts payable
- Short-term loans
- Accrued expenses
- Taxes owed
- Current portion of long-term debt
- Deferred revenue
Example of a current ratio calculation
Seeing the formula in action makes it easier to understand. Here are two examples that show different outcomes.
Example 1: ratio above 1.0
A small construction business wants to check whether it can cover upcoming loan repayments and material costs. It has £250,000 in current assets and £175,000 in current liabilities.
£250,000 ÷ £175,000 = 1.43
The ratio is above 1.0, so the business can cover its upcoming liabilities. For every £1 owed, the company has £1.43 available. With this buffer, the business could invest surplus cash in growth opportunities or hold the extra funds as a safety net for quieter periods.
Example 2: ratio below 1.0
A seasonal retail shop has £80,000 in current assets and £110,000 in current liabilities during its off-peak months.
£80,000 ÷ £110,000 = 0.73
The ratio is below 1.0, which means the business doesn't currently have enough short-term assets to cover its short-term debts. For every £1 owed, it has only £0.73 available. This doesn't necessarily mean the business is failing; it may simply reflect a seasonal dip. But it does signal a need to manage cash flow carefully until revenue picks back up.
How to interpret your current ratio
A current ratio of 1.0 or higher generally means your business can cover its short-term debts. While some analysts suggest a ratio above 2.0 is ideal, most consider anything over 1.0 acceptable, as the right range depends on your industry.
Here's how to read different ranges:
- Above 2.0: Strong liquidity, but consider whether excess cash could be put to better use funding growth
- 1.0 to 2.0: A healthy balance between liquidity and efficient asset use, aligning with the expected range noted in this ACCA resource
- Below 1.0: May signal difficulty paying short-term obligations, though it can be acceptable temporarily for growing businesses
A ratio below 1.0 isn't always cause for alarm. Businesses investing heavily in expansion often see temporary dips. However, a ratio that stays below 1.0 over several months warrants attention.
Industry-specific benchmarks
Your ideal current ratio depends on the type of business you run. Different industries have different working capital needs, so what looks healthy in one sector may look weak in another.
Here are some typical ranges, referenced in ACCA's ratio analysis guide:
- Retail: 1.0–1.5, because inventory turns into cash quickly
- Manufacturing: 1.5–2.5, as raw materials and work-in-progress tie up more capital
- Professional services: 1.2–2.0, since these businesses typically carry fewer physical assets
Use these ranges as a starting point, then compare your ratio against direct competitors in your sector for a more meaningful benchmark.
How to track your current ratio over time
A single snapshot tells you where you stand today, but tracking your ratio over time reveals trends that matter more. Monthly monitoring helps you spot problems before they become urgent.
Calculate your current ratio at the same point each month; for example, the last business day. This creates consistent comparisons and avoids distortions from billing cycles or one-off payments.
Compare each month's figure to the same month in the previous year. Year-over-year comparisons account for seasonal patterns that month-to-month tracking can miss. If your ratio is trending downward over several months, investigate whether liabilities are growing faster than assets, or whether slow-paying customers are stretching your receivables. Xero's reporting tools can help you track these movements automatically.
What are the limitations of using the current ratio?
The current ratio provides a useful snapshot, but it has limitations worth understanding before you rely on it alone.
- Asset quality differences: The ratio treats all current assets equally, yet cash is immediately available while inventory may take months to sell
- Timing blind spots: The calculation assumes all liabilities come due at the same time, which rarely reflects reality
- Daily cash fluctuations: Cash flow changes constantly, but the ratio captures only a single moment in time
- Seasonal distortions: Businesses with seasonal revenue may see misleading ratios during slow periods
- Window dressing risk: Companies can temporarily inflate their ratio near reporting dates by delaying purchases or accelerating collections, which makes the figure look healthier than the underlying position
For a fuller picture, pair your current ratio with cash flow forecasts and other liquidity measures. Xero's dashboard gives you real-time visibility into these metrics, so you're never relying on a single number.
Current ratio vs quick ratio and other liquidity ratios
The current ratio offers a broad view of liquidity, while other ratios provide more focused perspectives. Using them together gives you a more complete understanding of your cash position.
- Quick ratio (acid test ratio): Includes only assets convertible to cash within 90 days, excluding inventory and prepaid expenses. Use this for a more conservative view of whether you can meet short-term obligations
- Cash ratio: Compares only cash and cash equivalents to current liabilities. This is the strictest measure of immediate payment ability
- Operating cash flow ratio: Divides operating cash flow by current liabilities. Unlike the other ratios, it uses actual cash generated from operations rather than balance sheet figures, which makes it useful for assessing whether your day-to-day business generates enough cash to cover debts
Each ratio answers a different question about your financial health. Learn more about these metrics in the guide to liquidity ratios.
Current ratio in relation to working capital and cash flow
The current ratio connects to several related financial measures. Understanding how they differ helps you assess your overall financial position more accurately.
- Working capital: The difference between current assets and current liabilities, expressed as a pound amount rather than a ratio. A positive working capital figure means the same thing as a current ratio above 1.0
- Cash flow: The net movement of money in and out of your bank account over time. Unlike the current ratio snapshot, cash flow tracks ongoing liquidity and shows whether your business generates enough money to keep operating. Learn how to calculate cash flow for your business
- Free cash flow: Operating cash flow minus capital expenditure. This shows how much cash remains after investing in equipment, property, or other long-term assets
The current ratio tells you whether you can pay your bills at a given point. Working capital and cash flow measures help you understand how money moves through your business over time. Together with profitability ratios, they give you a rounded view of financial health.
How lenders and investors use the current ratio
Your current ratio isn't just a number for internal use. Lenders, investors, and your own management team all look at it when making decisions about your business.
How lenders assess creditworthiness
Banks and lenders review your current ratio when you apply for loans or credit facilities. A ratio well above 1.0 tells them you're likely to repay on time, because you have sufficient short-term assets to cover obligations. A low or declining ratio may lead to higher interest rates, stricter terms, or a declined application.
How investors evaluate financial stability
Investors use the current ratio as one measure of whether your business is financially stable. A consistently healthy ratio suggests sound cash management and lower risk. Investors also compare your ratio to industry benchmarks and competitors to gauge relative performance.
How management uses it for operational decisions
Tracking your current ratio helps you make better day-to-day decisions. If the ratio is climbing too high, you might choose to invest surplus cash in stock, equipment, or marketing. If it's dropping, you might tighten credit terms for customers or negotiate longer payment windows with suppliers. Xero's real-time reporting helps you monitor these shifts without waiting for end-of-month accounts.
Monitor your current ratio and cash flow with Xero
Keeping track of your current ratio doesn't need to involve manual calculations or spreadsheets. Xero handles the complex maths automatically and gives you a clear picture of your cash position.
With Xero, you can:
- View your cash flow at a glance from any device
- Track expenditure and monitor financial ratios over time
- Create forecasts and projections with built-in reporting tools
- Spot trends early so you can act before cash flow problems develop
Make better-informed financial decisions without the manual number-crunching. Get one month free.
FAQs on current ratio
Here are answers to frequently asked questions about current ratio, from what counts as a healthy figure to how often you should check yours.
What is a good current ratio?
Most healthy businesses aim for a current ratio between 1.2 and 2.0. The right figure depends on your industry; retail businesses often operate comfortably at the lower end because inventory converts to cash quickly, while manufacturing businesses typically need a higher ratio to cover raw material costs.
Is 1.0 a good current ratio?
A ratio of exactly 1.0 means your current assets precisely equal your current liabilities. While you can technically meet your obligations, there's no buffer for unexpected expenses or late-paying customers. Most businesses benefit from maintaining a ratio above 1.2 to allow some breathing room.
How often should I calculate my current ratio?
Calculate it monthly, at the same point in your billing cycle each time. Consistent timing creates reliable comparisons and helps you spot downward trends before they turn into cash flow problems. Quarterly reviews are a minimum if monthly tracking isn't practical.
Can my current ratio be too high?
Yes. A ratio consistently above 3.0 may suggest you're holding excess cash or inventory that could be invested in growth. Review whether surplus assets could generate better returns elsewhere, such as paying down debt, upgrading equipment, or expanding your team.
What's the difference between current ratio and quick ratio?
The current ratio includes all current assets, while the quick ratio excludes inventory and prepaid expenses. The quick ratio gives you a more conservative view of liquidity by focusing only on assets you can convert to cash within 90 days. Using both ratios together provides a clearer picture of your short-term financial position.
What is a bad current ratio?
A current ratio below 1.0 means your short-term liabilities exceed your short-term assets, which may indicate difficulty paying upcoming bills. However, context matters; a temporary dip during seasonal slowdowns or a growth phase isn't necessarily a crisis. A ratio that stays below 1.0 for several consecutive months is a stronger warning sign that warrants action.
Disclaimer
Xero does not provide accounting, tax, business or legal advice. This guide has been provided for information purposes only. You should consult your own professional advisors for advice directly relating to your business or before taking action in relation to any of the content provided.
Get one month free
Purchase any Xero plan, and we will give you the first month free.