Chart of accounts (COA)
A chart of accounts organises every transaction in your books. See how to set one up for your business.
Published Wednesday 30 September 2026
Table of contents
Key takeaways
- A chart of accounts lists every account your business uses to record transactions, each with a name and a code
- It groups accounts into five types: assets, liabilities, equity, revenue and expenses
- The chart holds the account names and codes, while the general ledger holds the transactions posted to them
- A tidy, well-numbered chart makes your reports easier to read and your tax records easier to keep
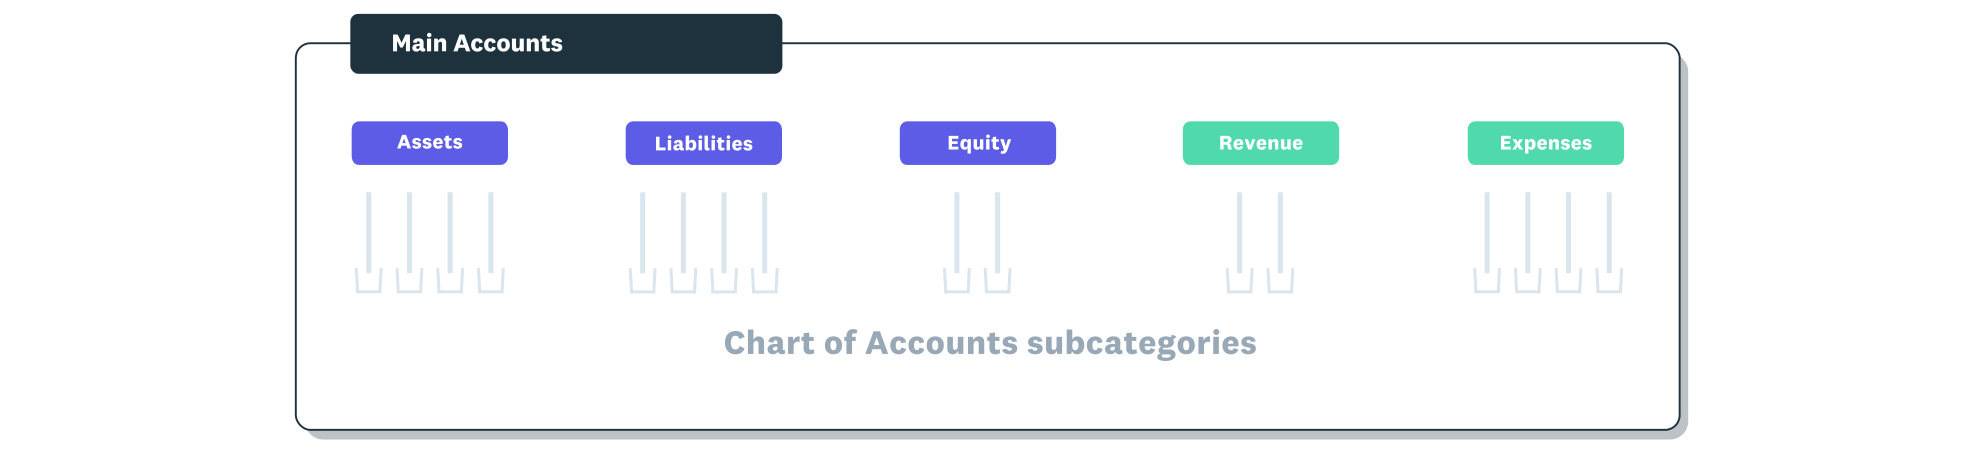
The chart of accounts is organised under the five main account types.
Chart of accounts definition
A chart of accounts (COA) is a list of every account your business uses to record money coming in and going out. Each account has a name and a code, and together they form the index for your general ledger.
Think of it as the labels on a set of filing drawers. When a customer pays you or you pay your landlord, the chart tells you which drawer that transaction belongs in.
Why a chart of accounts matters for your business
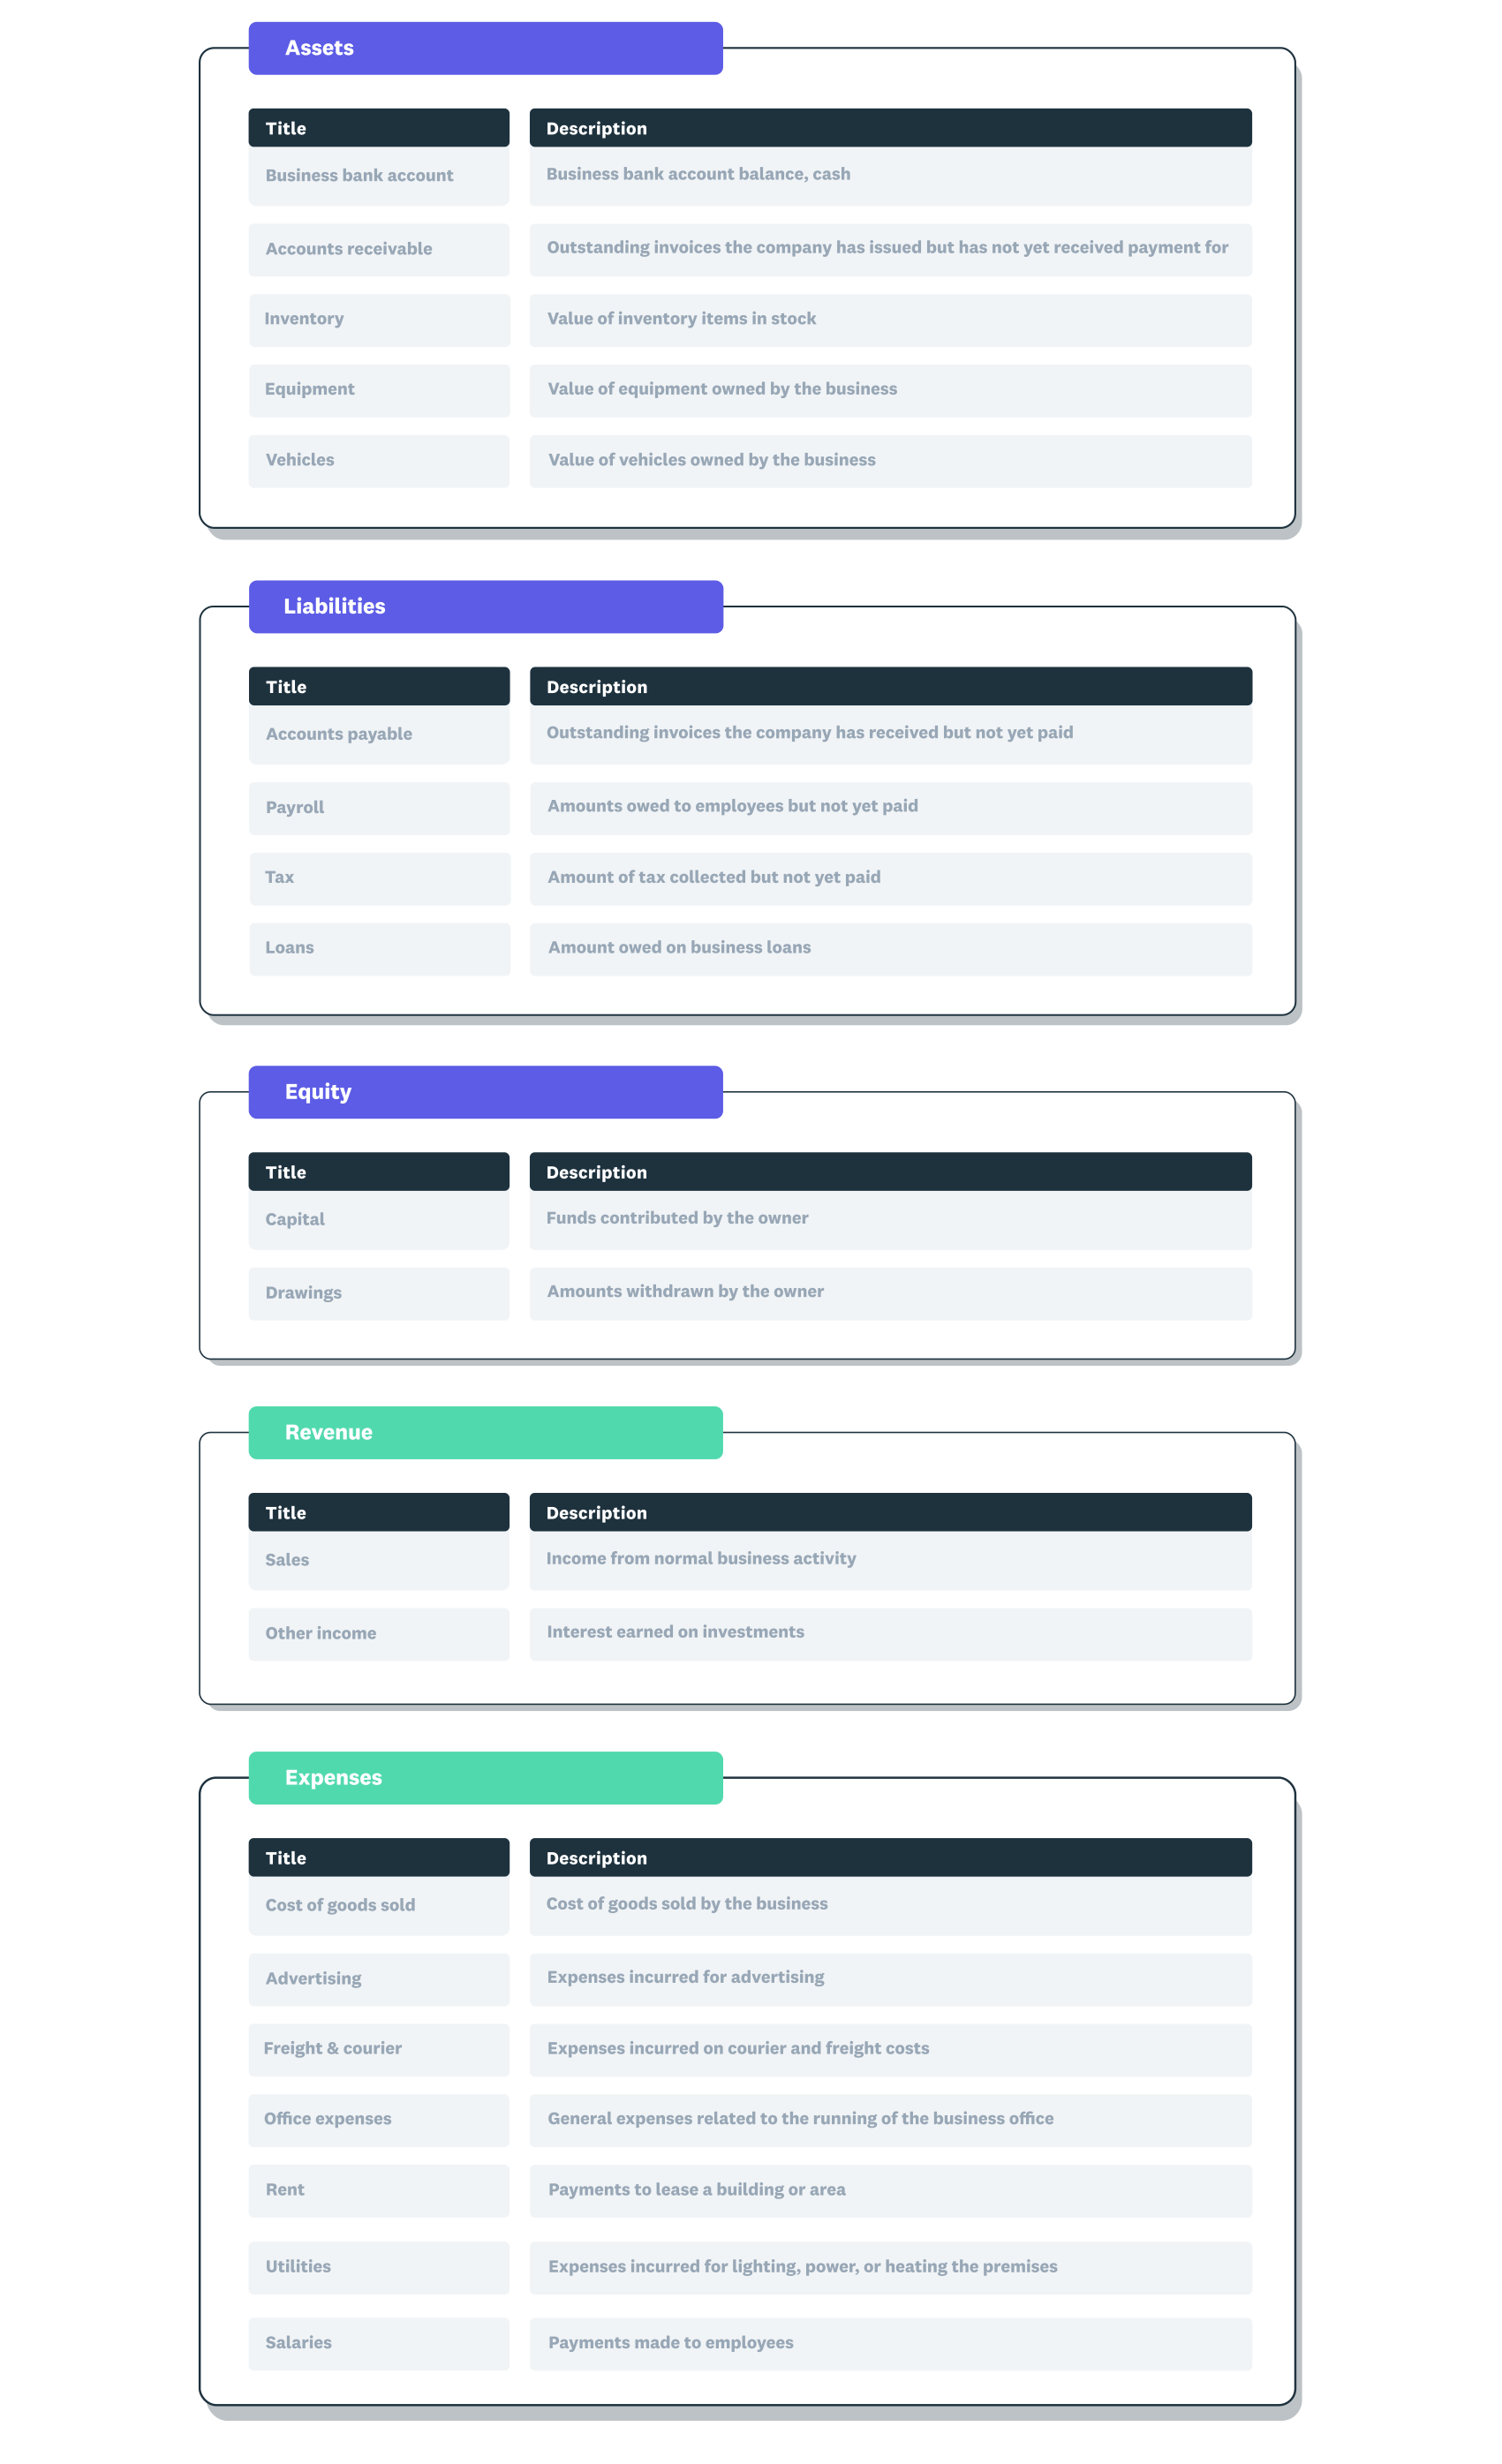
A chart of accounts example showing the five main account types with subcategories within each.
Once every transaction has a home, your books become far easier to run. A well-built chart helps you:
- code each sale and expense the same way every time
- see which parts of your business earn the most and cost the most
- produce reports your accountant can review quickly
- make pricing and spending decisions based on accurate figures
A good chart also makes it simpler to meet Inland Revenue Authority of Singapore (IRAS) rules. IRAS requires companies to keep accounting records and source documents for at least five years from the relevant Year of Assessment.
With a consistent chart, those records stay sorted and easy to find if IRAS asks for them.
The 5 types of accounts in a chart of accounts
Every chart of accounts is built on five account types, and each one tracks a different part of your finances. Here’s what each type covers, with examples you’ll see in a Singapore business:
- Asset accounts track what your business owns, such as your bank account and accounts receivable
- Liability accounts track what your business owes, such as Goods and Services Tax (GST) payable and Central Provident Fund (CPF) contributions payable
- Equity accounts track the owner’s stake in the business, such as owner’s capital and retained earnings
- Revenue accounts track the money you earn, such as sales and service income
- Expense accounts track the costs of running your business, such as rent and utilities
Each type also increases on a set side of the ledger. Debits increase assets and expenses, while credits increase liabilities, equity and revenue.
How a chart of accounts is organised
Your chart follows the same order as your financial statements. Balance sheet accounts come first (assets, liabilities and equity), followed by the revenue and expense accounts that make up your profit and loss statement.
Each account gets a code that shows where to record a transaction. Codes usually run in ranges: assets in the 1000s, liabilities in the 2000s, equity in the 3000s, revenue in the 4000s and expenses in the 5000s.
Sub-codes let you break a type into more detail. Under expenses, for example, 5100 could be rent and 5200 could be utilities. Leave gaps between codes so you can slot in new accounts later without renumbering.
Chart of accounts vs general ledger
The two are closely linked, but they do different jobs. The chart of accounts is the list of account names and codes, while the general ledger holds the actual transactions posted to those accounts.
Under double-entry bookkeeping, each transaction touches at least two accounts. Say you pay S$2,000 in rent: the ledger records a S$2,000 debit to 5100 Rent and a S$2,000 credit to 1000 Bank.
The chart tells you which accounts to use, and the ledger keeps the running record. Together, they keep both sides of every transaction in balance.
How to set up a chart of accounts
Your accounting method shapes which accounts you need, so it comes first. Follow these steps to build a working chart:
- Choose cash or accrual accounting, since accrual needs accounts such as accounts receivable and accounts payable.
- Set up the five main account types and give each one its own code range.
- Add sub-accounts for the ways your business earns and spends money, each with a clear name and its own code.
- Check the default chart in your accounting software, which usually comes ready to edit, and rename accounts to fit your business.
- Ask your accountant to review the chart before you start posting transactions, so you avoid recoding transactions later.
Chart of accounts example
Here’s how a simple chart might look for a small Singapore retail business. The codes follow the ranges above, with gaps left for new accounts:
- 1000 Bank
- 1100 Accounts receivable
- 2000 Accounts payable
- 2100 GST payable
- 3000 Owner’s capital
- 4000 Sales
- 5100 Rent
- 5200 Utilities
As the business grows, you might add 2200 CPF contributions payable when you hire staff, or 4100 Service income if you start offering consulting alongside product sales.
Chart of accounts best practices
A few habits keep your chart useful for years. Use these as a checklist when you set up or review yours:
- Use descriptive account names that anyone on your team can understand
- Keep the chart lean, adding accounts only when you’ll report on them
- Archive accounts that already hold transactions instead of deleting them, so your history stays intact
- Review the chart regularly, for example at each financial year end
- Separate personal and business spending into their own accounts
Simplify your chart of accounts with Xero
A well-structured chart of accounts turns everyday bookkeeping into reliable information you can act on. Xero gives you a ready-made chart to edit, then turns every coded bank feed transaction into financial reports in real time.
Spend less time sorting transactions and more time running your business when you get one month free with Xero.
FAQs on chart of accounts
Here are quick answers to common questions about setting up and using a chart of accounts in Singapore.
Can you change your chart of accounts after setting it up?
You can add new accounts or archive old ones at any time. Bigger changes work best at the start of a financial year, so your reports compare cleanly.
Is there a standard chart of accounts format?
Most charts follow the same five-type order and numbered codes, though no single format is mandatory. Many businesses start from an industry template or their software’s default and adjust the account names.
Is a chart of accounts required in Singapore?
IRAS requires proper accounting records rather than a specific chart of accounts. A chart gives those records a consistent structure, which makes them easier to prepare and check.
Does accounting software come with a chart of accounts?
Most accounting software includes one, and Xero creates a default chart when you set up your organisation. You can also import your own chart if your accountant has already built one for you.
Should sole proprietors use a chart of accounts?
Yes, because even a short chart keeps business income and costs apart. That makes your profit easier to work out when you prepare your income tax return.
Related terms
Learn more about chart of accounts
Handy resources
Advisor directory
You can search for experts in our advisor directory
Xero Small Business Guides
Discover resources to help you do better business
Online accounting with Xero
Automate your accounting in the cloud
Disclaimer
This glossary is for small business owners. The definitions are written with their requirements in mind. More detailed definitions can be found in accounting textbooks or from an accounting professional. Xero does not provide accounting, tax, business or legal advice.