Current ratio: formula, examples and what it means
Learn how the current ratio helps you measure short term liquidity and manage your cash flow.
Written by Jotika Teli—Certified Public Accountant with 24 years of experience. Read Jotika's full bio
Published Tuesday 21 April 2026
Table of contents
Key takeaways
- Calculate your current ratio by dividing your current assets by your current liabilities, and aim to keep the result at 1.5 or above to maintain a healthy financial buffer and cover short-term debts with confidence.
- Recognize that a ratio above 2.5 may signal idle cash that could be put to work, while a ratio below 1.0 is a prompt to speed up invoice collection, negotiate longer payment terms with suppliers, and cut non-essential spending.
- Track your current ratio at the same time each month rather than reacting to one-off results, so you can spot meaningful trends and make informed decisions about cash flow and growth.
- Avoid relying on the current ratio alone, as it only captures a single point in time and treats all assets as equally liquid — combine it with cash flow forecasts and other financial ratios for a complete picture of your business health.
Current ratio definition
Current ratio measures your business's ability to pay short-term debts using current assets, noting that a generally acceptable current ratio is 2:1. This liquidity ratio shows whether you can cover bills and loan repayments due within the next year. You might also see it called the working capital ratio.
Unlike the quick ratio, current ratio includes all current assets, even those that take longer to convert to cash, like inventory. This gives you a wider view of how easily you can pay your short-term bills.
Current ratio formula
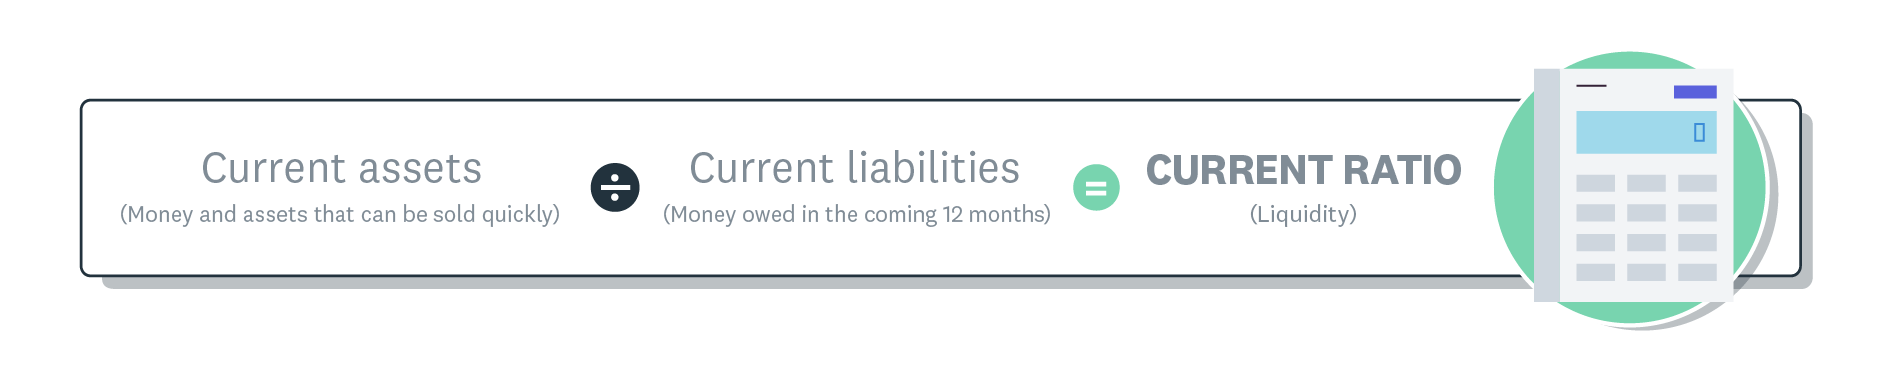
Current ratio formula: Current assets ÷ current liabilities = current ratio.
You need two numbers from your balance sheet to calculate it:
- Current assets: cash, accounts receivable, inventory, and other assets you expect to convert into cash within one year
- Current liabilities: bills, short-term loans, and other debts you must pay within one year
Current ratio liquidity formula.
Here's what the current ratio formula looks like:
Current ratio liquidity formula.
Example of a current ratio calculation
Scenario: A small construction business needs to assess its ability to cover upcoming loan repayments and material costs.
Given information:
- Current assets: $250,000
- Current liabilities: $175,000
Calculation: $250,000 ÷ $175,000 = 1.43
Result: A current ratio of 1.43 means the business can cover its short-term debts. For every $1 of liabilities, the company has $1.43 in assets available.
This surplus provides strategic options for your business. You can use the extra liquidity in several ways:
- Invest in business growth opportunities
- Build cash reserves for periods when assets may be lower
How to interpret your current ratio
A good current ratio falls between 1.5 and 2.0, which indicates a healthy financial buffer. A retail plant nursery case study demonstrated this with a 1.64 ratio. However, the ideal range can vary by industry.
Current ratio benchmarks: Here's how to interpret different ratio levels:
- 1.0 or higher: Shows healthy liquidity and ability to cover short-term debts.
- Above 2.5: Suggests excess cash that could be invested in growth, similar to a case study where a business's ratio reached 3.72 before optimisation.
- Below 1.0: Works temporarily if you're growing and investing, but plan to lift your ratio over time.
Key principle: Aim to keep your ratio at 1.0 or above to maintain healthy cash flow.
Monitoring best practices: Follow these guidelines to get the most value from tracking your current ratio:
- Calculate consistently: Measure your current ratio at the same time each month for accurate trend analysis.
- Track patterns: Look for long-term trends rather than focusing on single-month variations.
- Combine metrics: Use current ratio with other profitability ratios and cash flow forecasts for complete financial assessment.
Current ratio vs quick ratio and other liquidity ratios
Different liquidity ratios measure your ability to pay bills using different asset types. Each ratio focuses on a different subset of your assets:
- Current ratio: Includes all current assets for the most comprehensive view.
- Quick ratio: Excludes inventory and includes only assets convertible within 90 days for a more conservative measure.
- Cash ratio: Uses only cash and cash equivalents for the most stringent measure.
Each ratio shows something slightly different about how easily you can pay your bills. Learn more in our guide to liquidity ratios.
Current ratio in relation to working capital and cash flow
Current ratio connects to other key financial metrics that measure your business's spending power and financial health. Understanding these relationships helps you see the full picture.
Related financial measures: These metrics work alongside current ratio to give you a complete picture of your financial position:
- Working capital: Equals current assets minus current liabilities and shows money available after covering short-term debts.
- Cash flow: Tracks net money moving in and out of your business and measures overall cash availability.
- Free cash flow: Equals operating cash flow minus capital expenditure and indicates profitability after essential investments.
What are the limitations of using the current ratio?
Current ratio provides only a snapshot view of your financial position at one point in time. It also treats all current assets equally, despite varying liquidity speeds. Here's how conversion times differ:
- Cash: Converts immediately
- Inventory: Takes months to convert through sales
Additional limitations: There are other factors that can affect the usefulness of this ratio:
- Timing mismatches: Assumes all liabilities are due simultaneously, ignoring actual payment schedules.
- Daily fluctuations: Misses day-to-day changes in your cash flow.
- Seasonal variations: Gives a misleading view for businesses with strong seasonal patterns, so compare with results from the same season each year.
Using current ratio to make better business decisions
Your current ratio does more than show where you are today. It helps you decide what to do next. When you understand your number, you can plan how to use your cash and assets to reach your goals.
- Above 2.0 (high ratio): Suggests strong financial footing. Consider investing in growth by buying new equipment, hiring another team member, or paying down long-term debt.
- Below 1.0 (low ratio): Shows an opportunity to strengthen your cash position. Focus on getting invoices paid faster, negotiating longer payment terms with suppliers, and prioritising essential purchases.
Tracking your current ratio helps you spot opportunities and address challenges early.
Monitor your finances in real-time with Xero
Xero makes it easy for you to track your current ratio by automating the calculations and giving you clear financial insights.
Key benefits: Xero's financial tools help you stay on top of your current ratio and overall financial health:
- View instantly: See cash flow and current ratio at a glance.
- Track automatically: Monitor financial performance indicators over time.
- Forecast smartly: Create projections using built-in reporting features.
- Decide confidently: Access real-time data for informed financial planning.
FAQs on current ratio
Here are common questions about the current ratio.
What is considered a good current ratio?
A current ratio between 1.5 and 2.0 is generally considered healthy, showing you can comfortably cover short-term bills. The ideal ratio varies by industry.
Is a current ratio of 1.0 acceptable for small businesses?
A ratio of 1.0 is acceptable but leaves no room for unexpected expenses. Aim for above 1.0 to create a financial buffer.
What does a current ratio of 2.5 mean for my business?
A ratio of 2.5 means you have $2.50 in current assets for every $1.00 of current liabilities. This indicates strong financial health, though you may have idle cash that could be invested in growth.
How often should I calculate my current ratio?
Calculate your current ratio monthly to track trends and understand how business decisions affect your liquidity.
Can a current ratio be too high?
Yes. A consistently high ratio suggests you may not be using assets efficiently, with excess cash or slow-moving inventory that could be invested in growth.
Disclaimer
Xero does not provide accounting, tax, business or legal advice. This guide has been provided for information purposes only. You should consult your own professional advisors for advice directly relating to your business or before taking action in relation to any of the content provided.
Get one month free
Purchase any Xero plan, and we will give you the first month free.