How Huddle Advisory Crafts High-Impact, Tailored Solutions with Syft

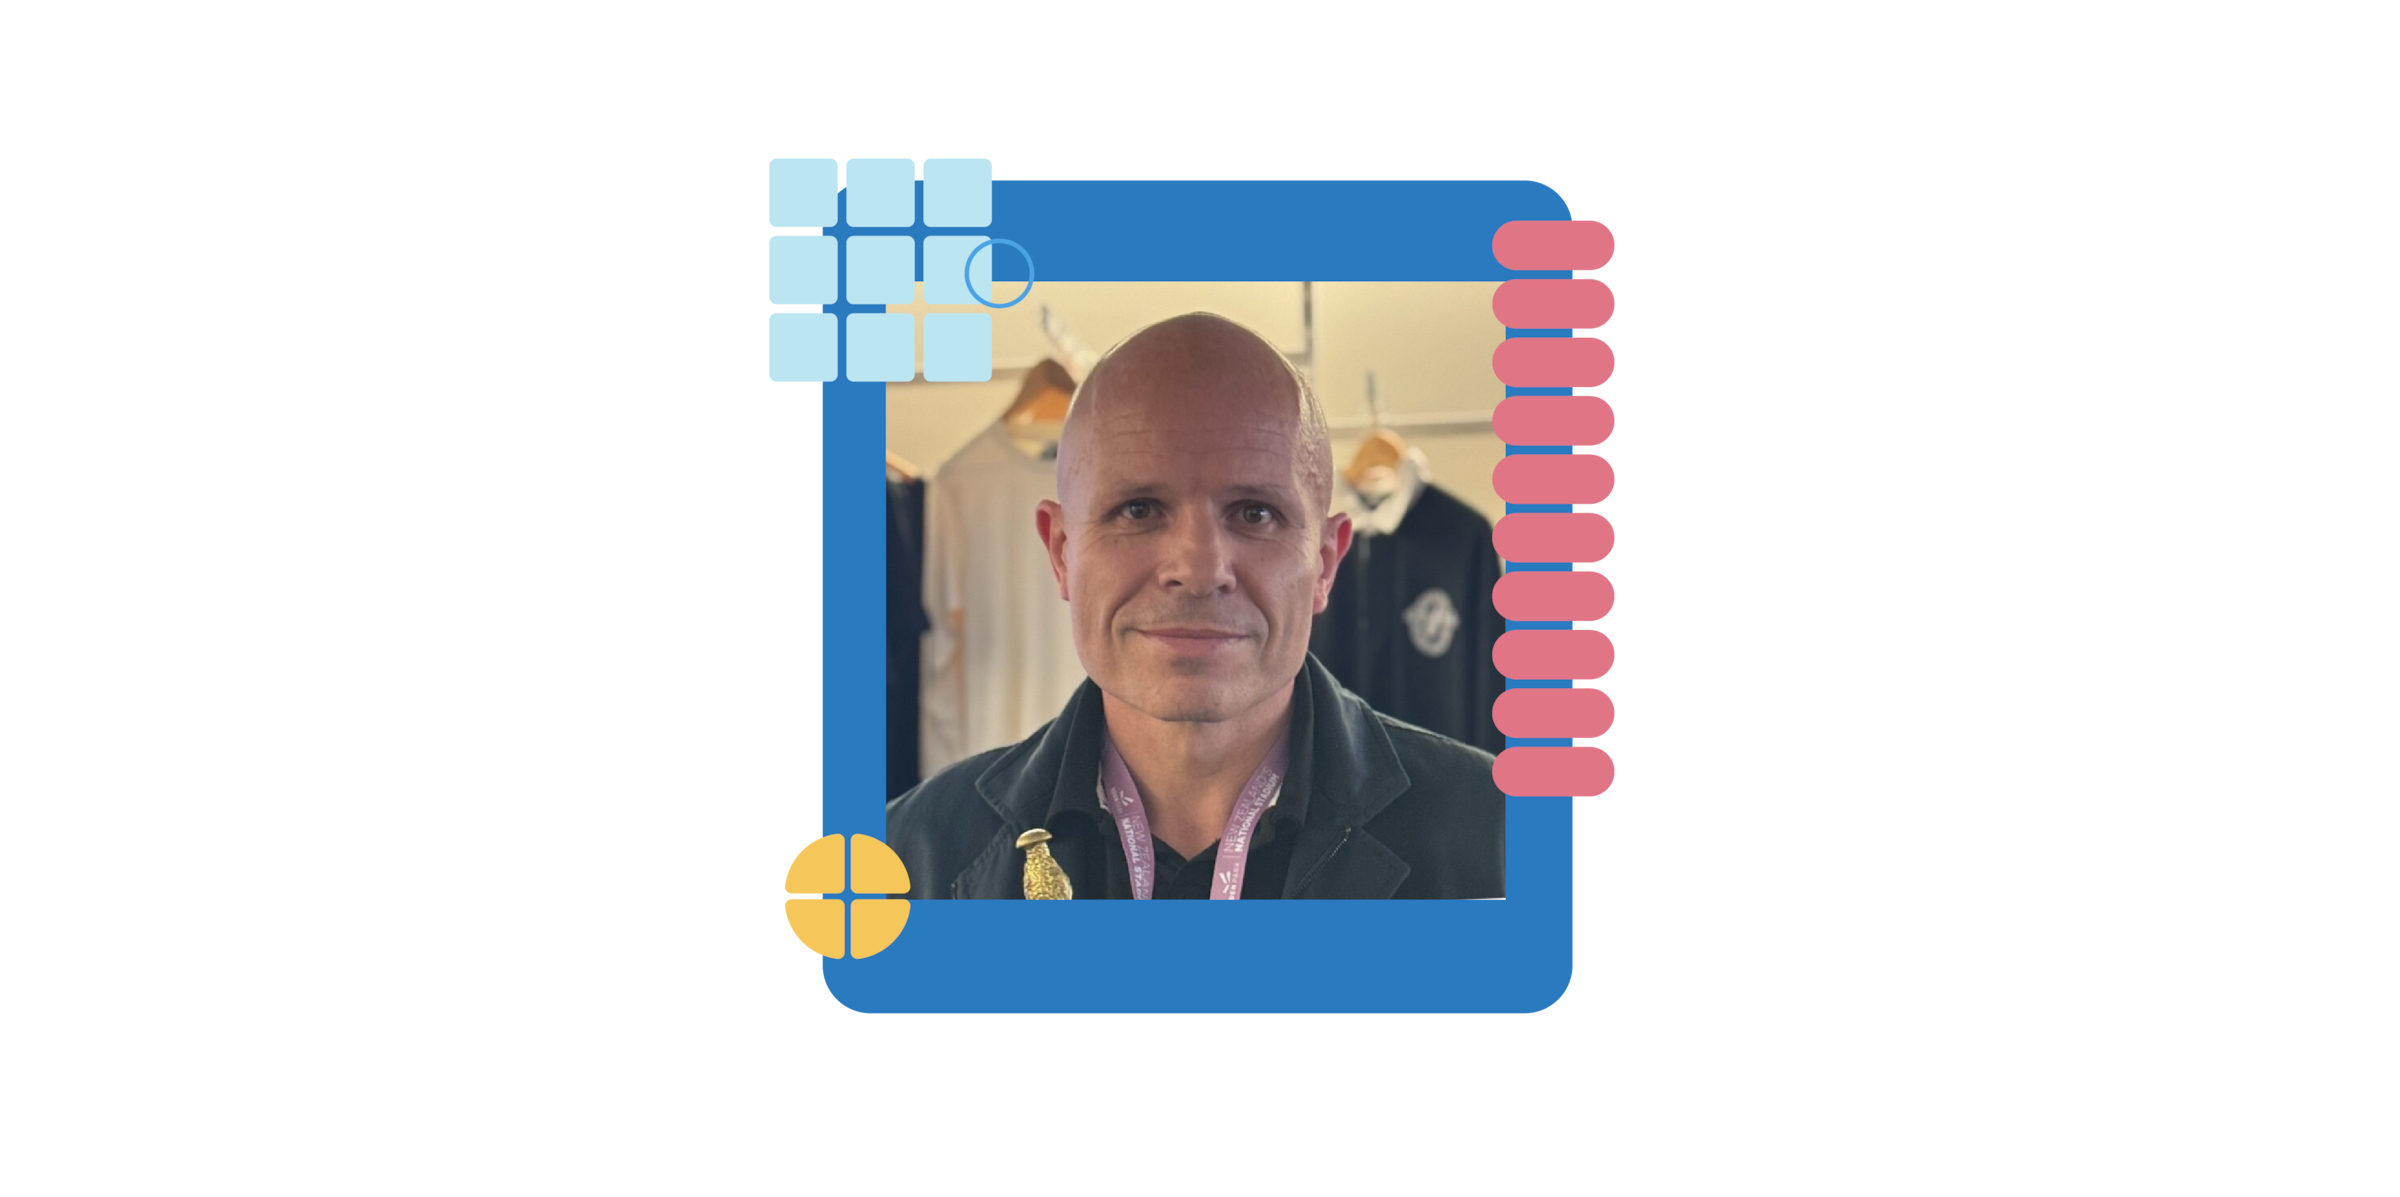
Huddle Advisory (Huddle) began as a traditional accountancy practice in New Zealand, with a team of industry-leading financial specialists and forward-thinking strategists. They are dedicated to fostering long-term relationships and collaborating closely with partners to deliver high-quality service and expert advice, ensuring clients achieve exceptional results. Mathew (Mat) Arcus started working there in 2010 and bought the practice in 2015.
Not long after buying the practice, Mat decided to upgrade the tech stack. A lot was changing in the software space and he wanted to ensure that his team was leading the charge. He says, “It was a really exciting time in terms of being at the forefront of something new. And we haven't changed that.” The first app he put in place was Xero, shortly followed by Xero Practice Manager.
Building tailored reports
Mat initially used reporting software that provided all clients with a standardized, one-size-fits-all report. For several clients, the information was not detailed enough. They wanted to be able to drill down and view real-time data. So, Mat searched for a more customisable reporting software – and found Syft Analytics.
The change since implementing Syft has been dramatic. Syft reports are fully customisable, able to drill down to the transaction level and update overnight.
“With Syft, I've been able to personalise a lot more what I can do for clients and provide information that meets their purposes a lot easier.” – Mathew Arcus, Director and Owner of Huddle Advisory
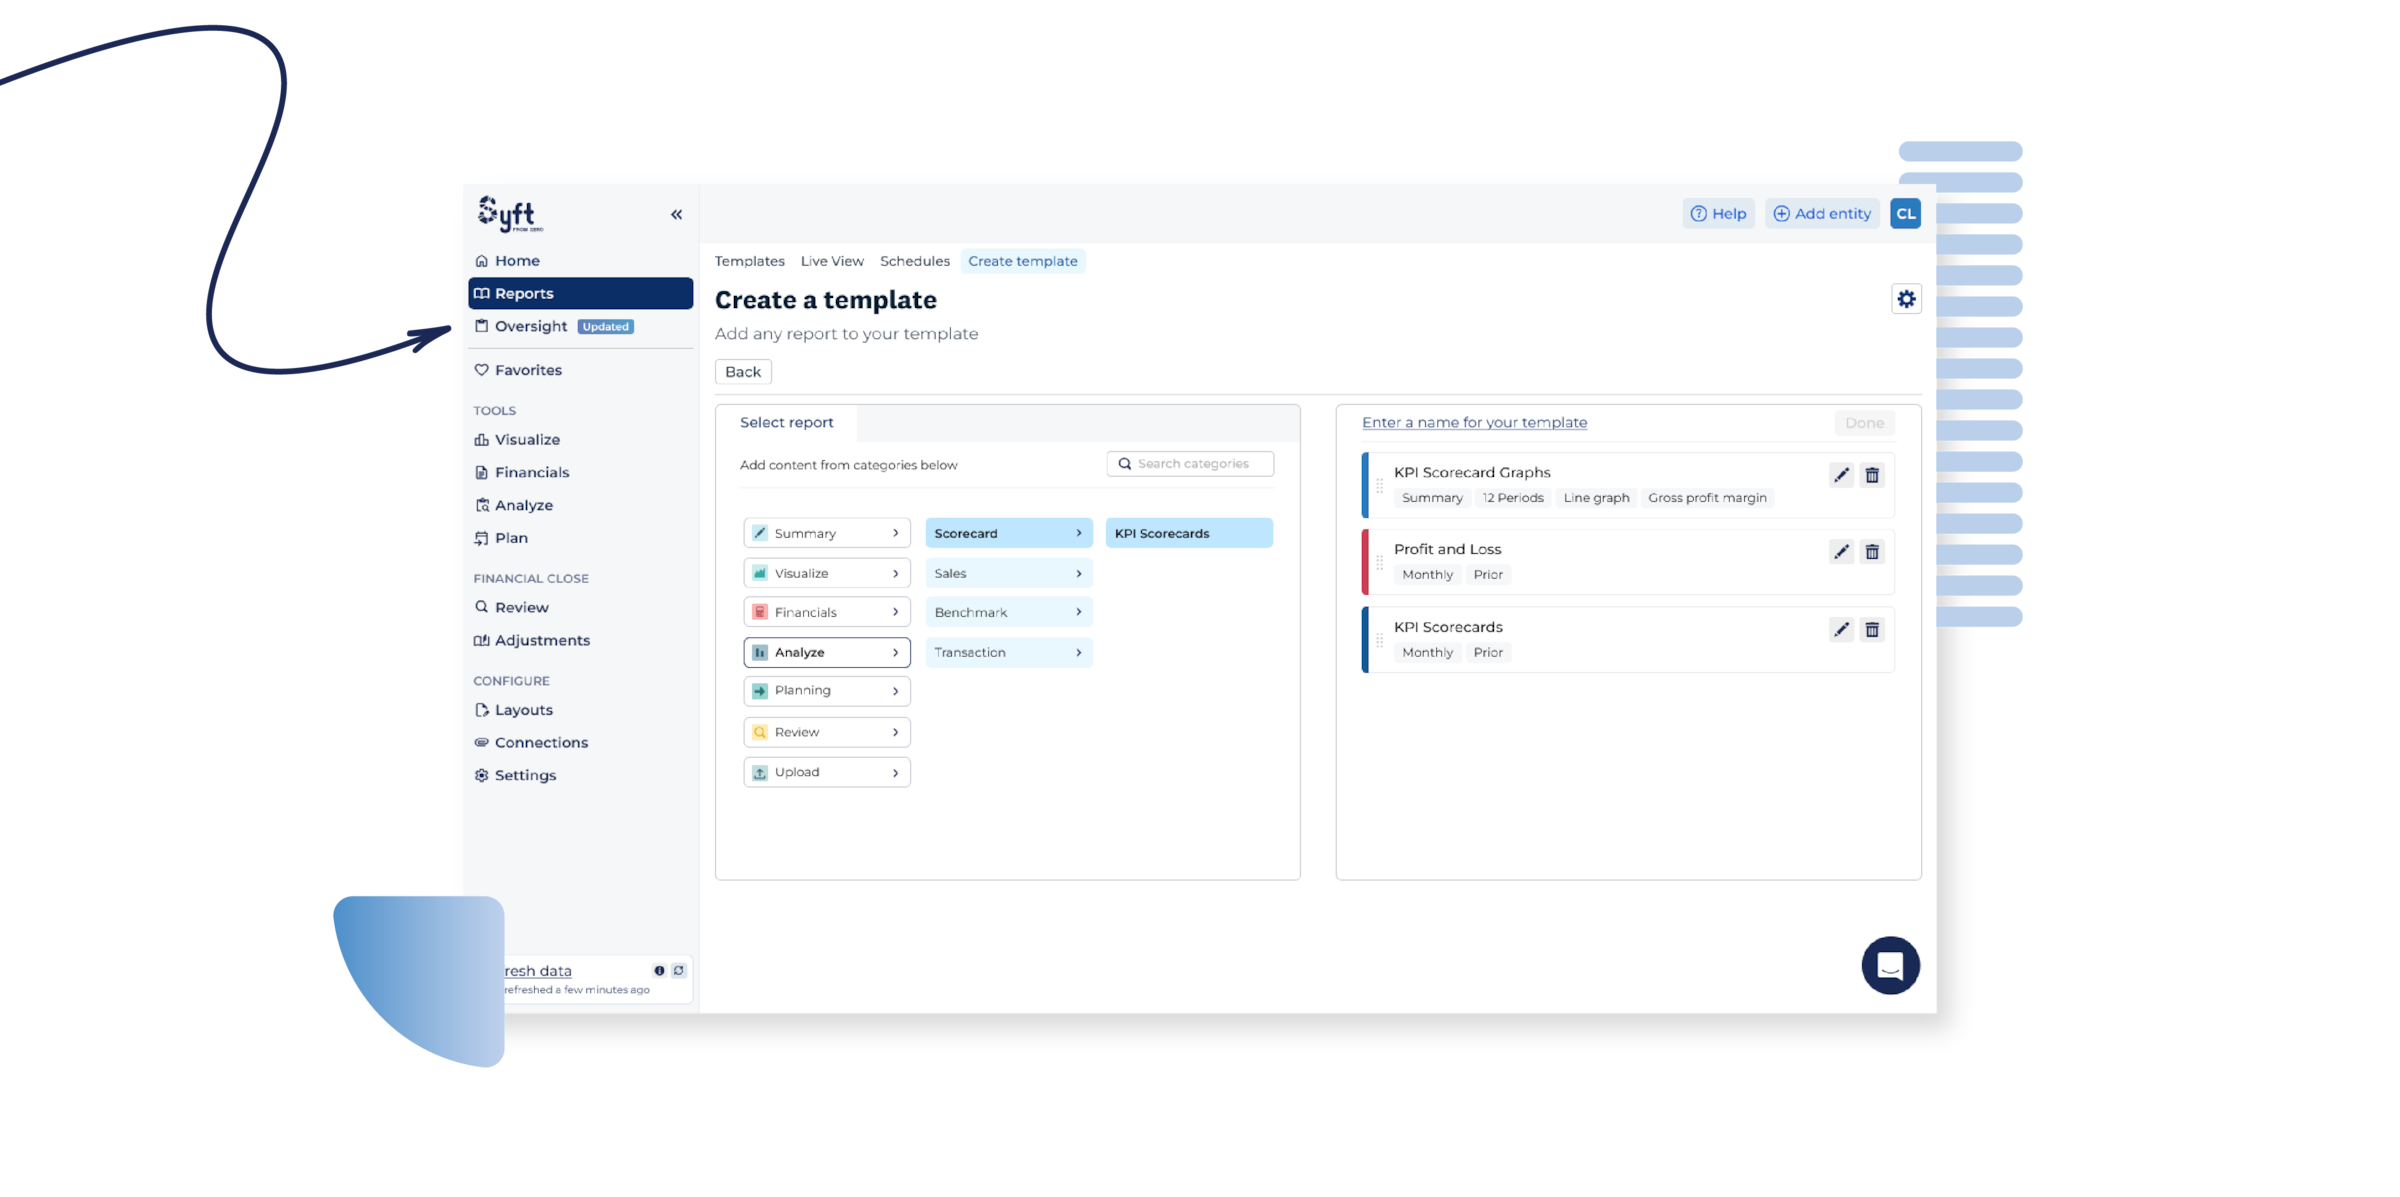
The team now provides bespoke reports, tailored to each client’s unique needs, which can be tweaked each month to suit evolving reporting requirements.
Changing workflows across the team
The first thing Mat does for any client is visit the Syft dashboard as this will provide clues about where to look by quickly highlighting unexpected outcomes. For example: “If the business is telling me they're doing really well, but profitability has been falling, I can see that in Syft easily and then I might dig into Xero to understand that.”
Answering business owners’ questions
Huddle doesn’t fit into a neat niche. They provide services to industries as diverse as food manufacturing, infrastructure, machinery service, consulting engineers, administrative businesses, and farmers. What’s most important to the team is the attitude of their clients.
Their clients’ businesses all have different needs, which can be addressed in bespoke Syft reports. For example, their consulting engineer clients are particularly interested in looking at benchmarking data to understand how their operating costs compare to others in the industry in this inflationary environment. They want to have a good understanding of how they stack up against industry peers so they can know what a good ratio of wages to sales might look like to answer two key questions that all business owners have:
1. Am I making money?
2. How do I compare to others in my industry?
So, Mat includes Syft’s benchmark reports in their monthly report packs to answer these questions. As he says, “Getting good benchmarking data has often been a problem but Syft starts to fill that gap with its benchmarking data.”
Analysing customer data
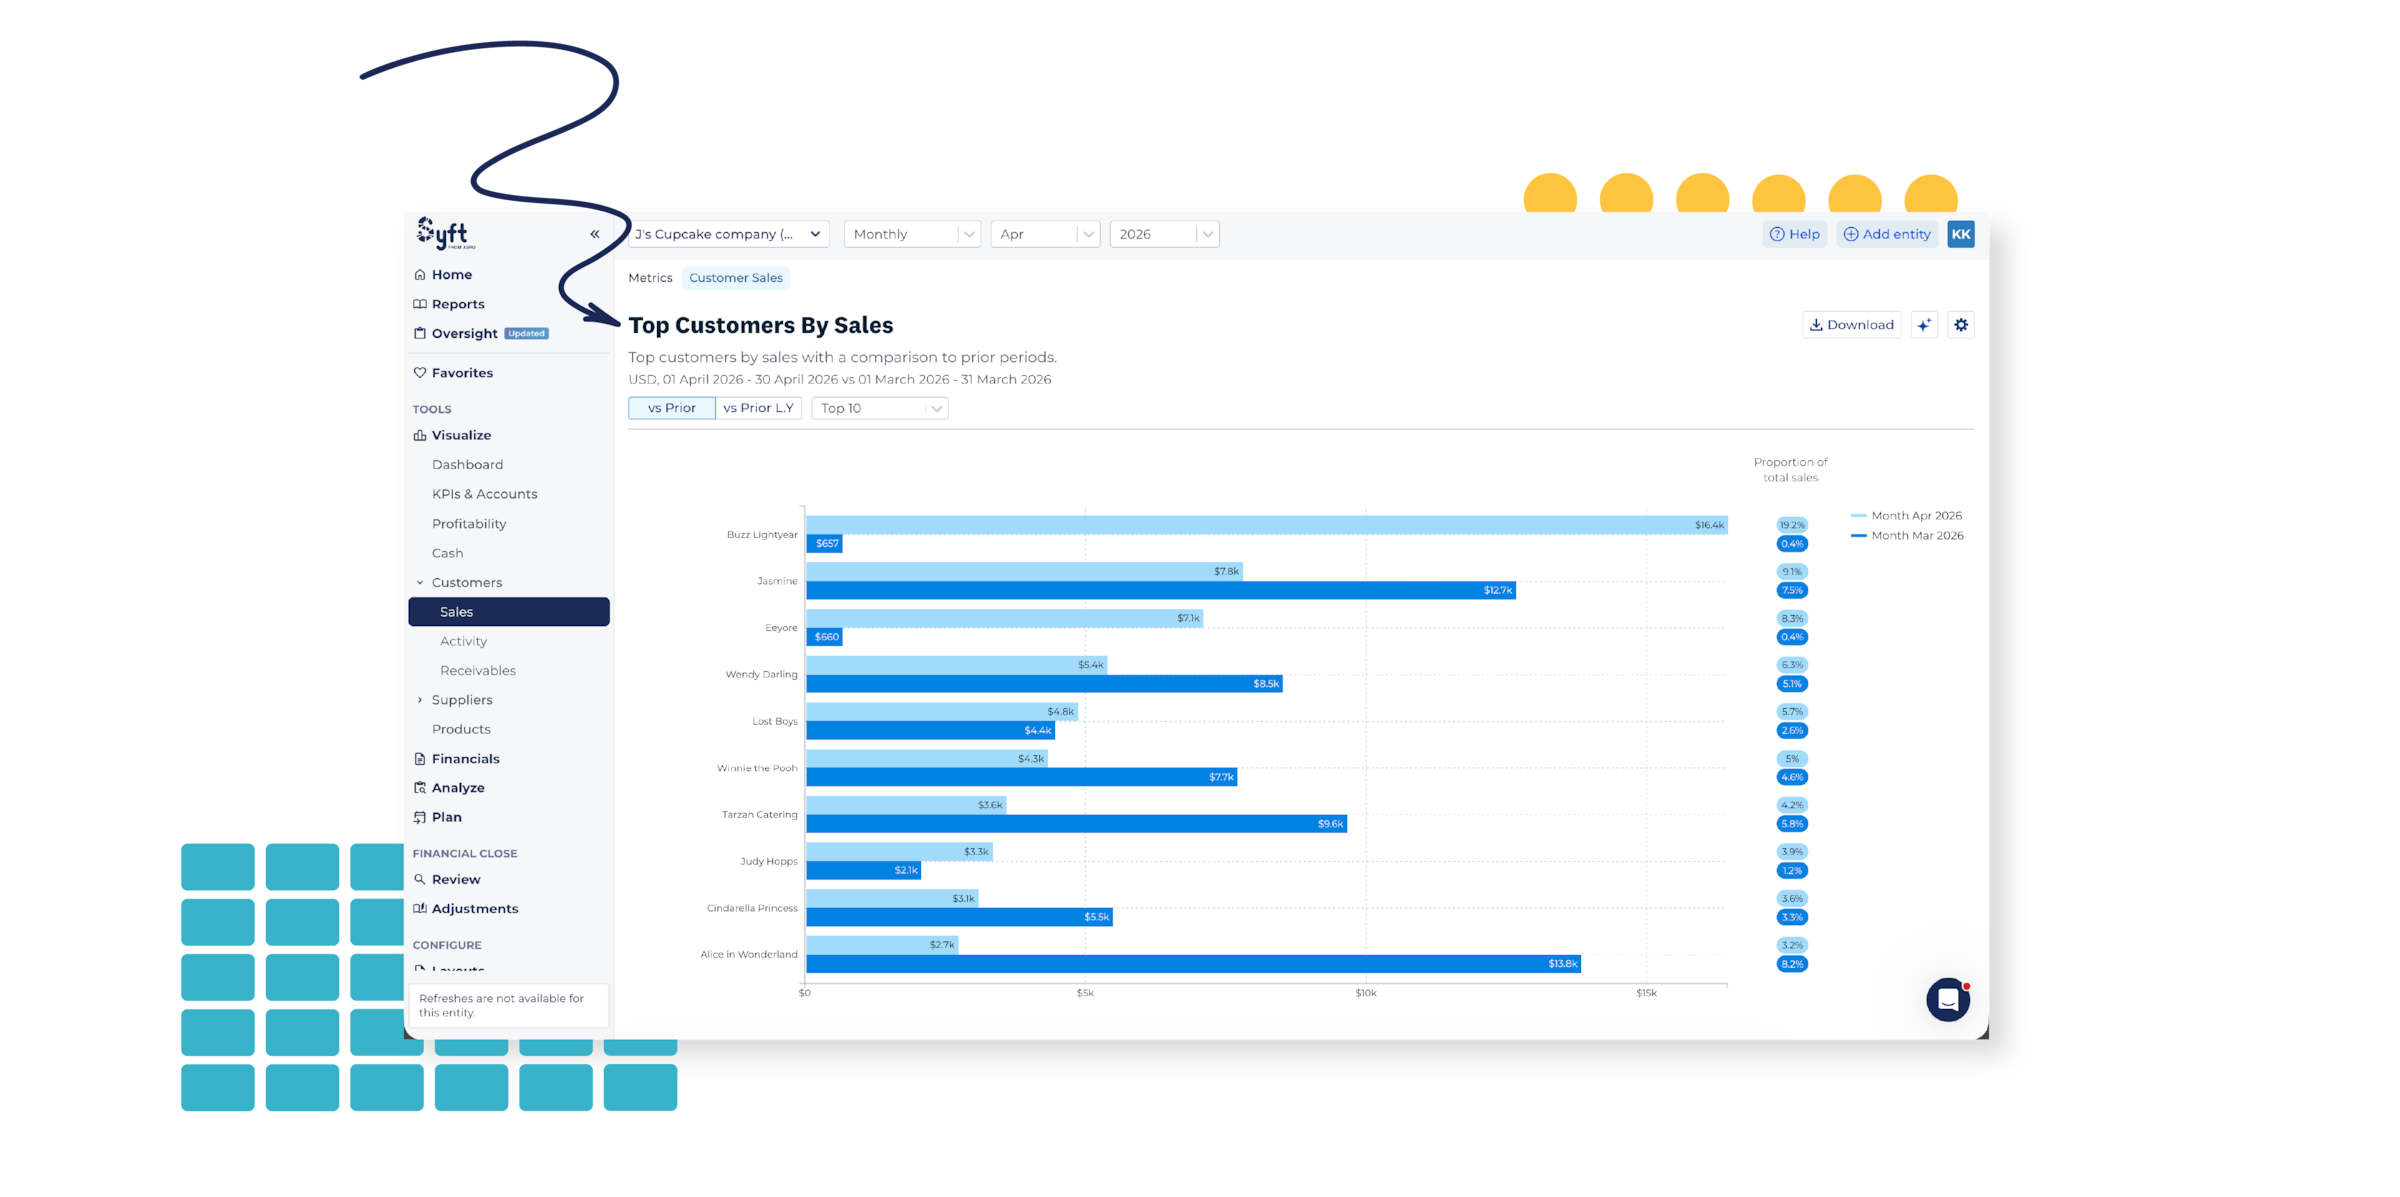
One of Huddle’s clients is a large food manufacturer. Mat regularly meets with this client to discuss his customer data by viewing the Top 10 Customers graph from Syft. He uses the comparative view to compare the top customers in the current period to those of the same period last year, to visually demonstrate changes in his customer base.
“He took a screenshot of that one graph and went to his sales team and was able to highlight to them really quickly where things were at.”
As this client is a visual person, this graph easily illuminated customer trends and dependencies that he would otherwise have missed. In addition, his team could instantly “see the impact of some of their sales program,” which enabled them to determine what was generating more sales and act on this information.
Comparing income and expenses to cash
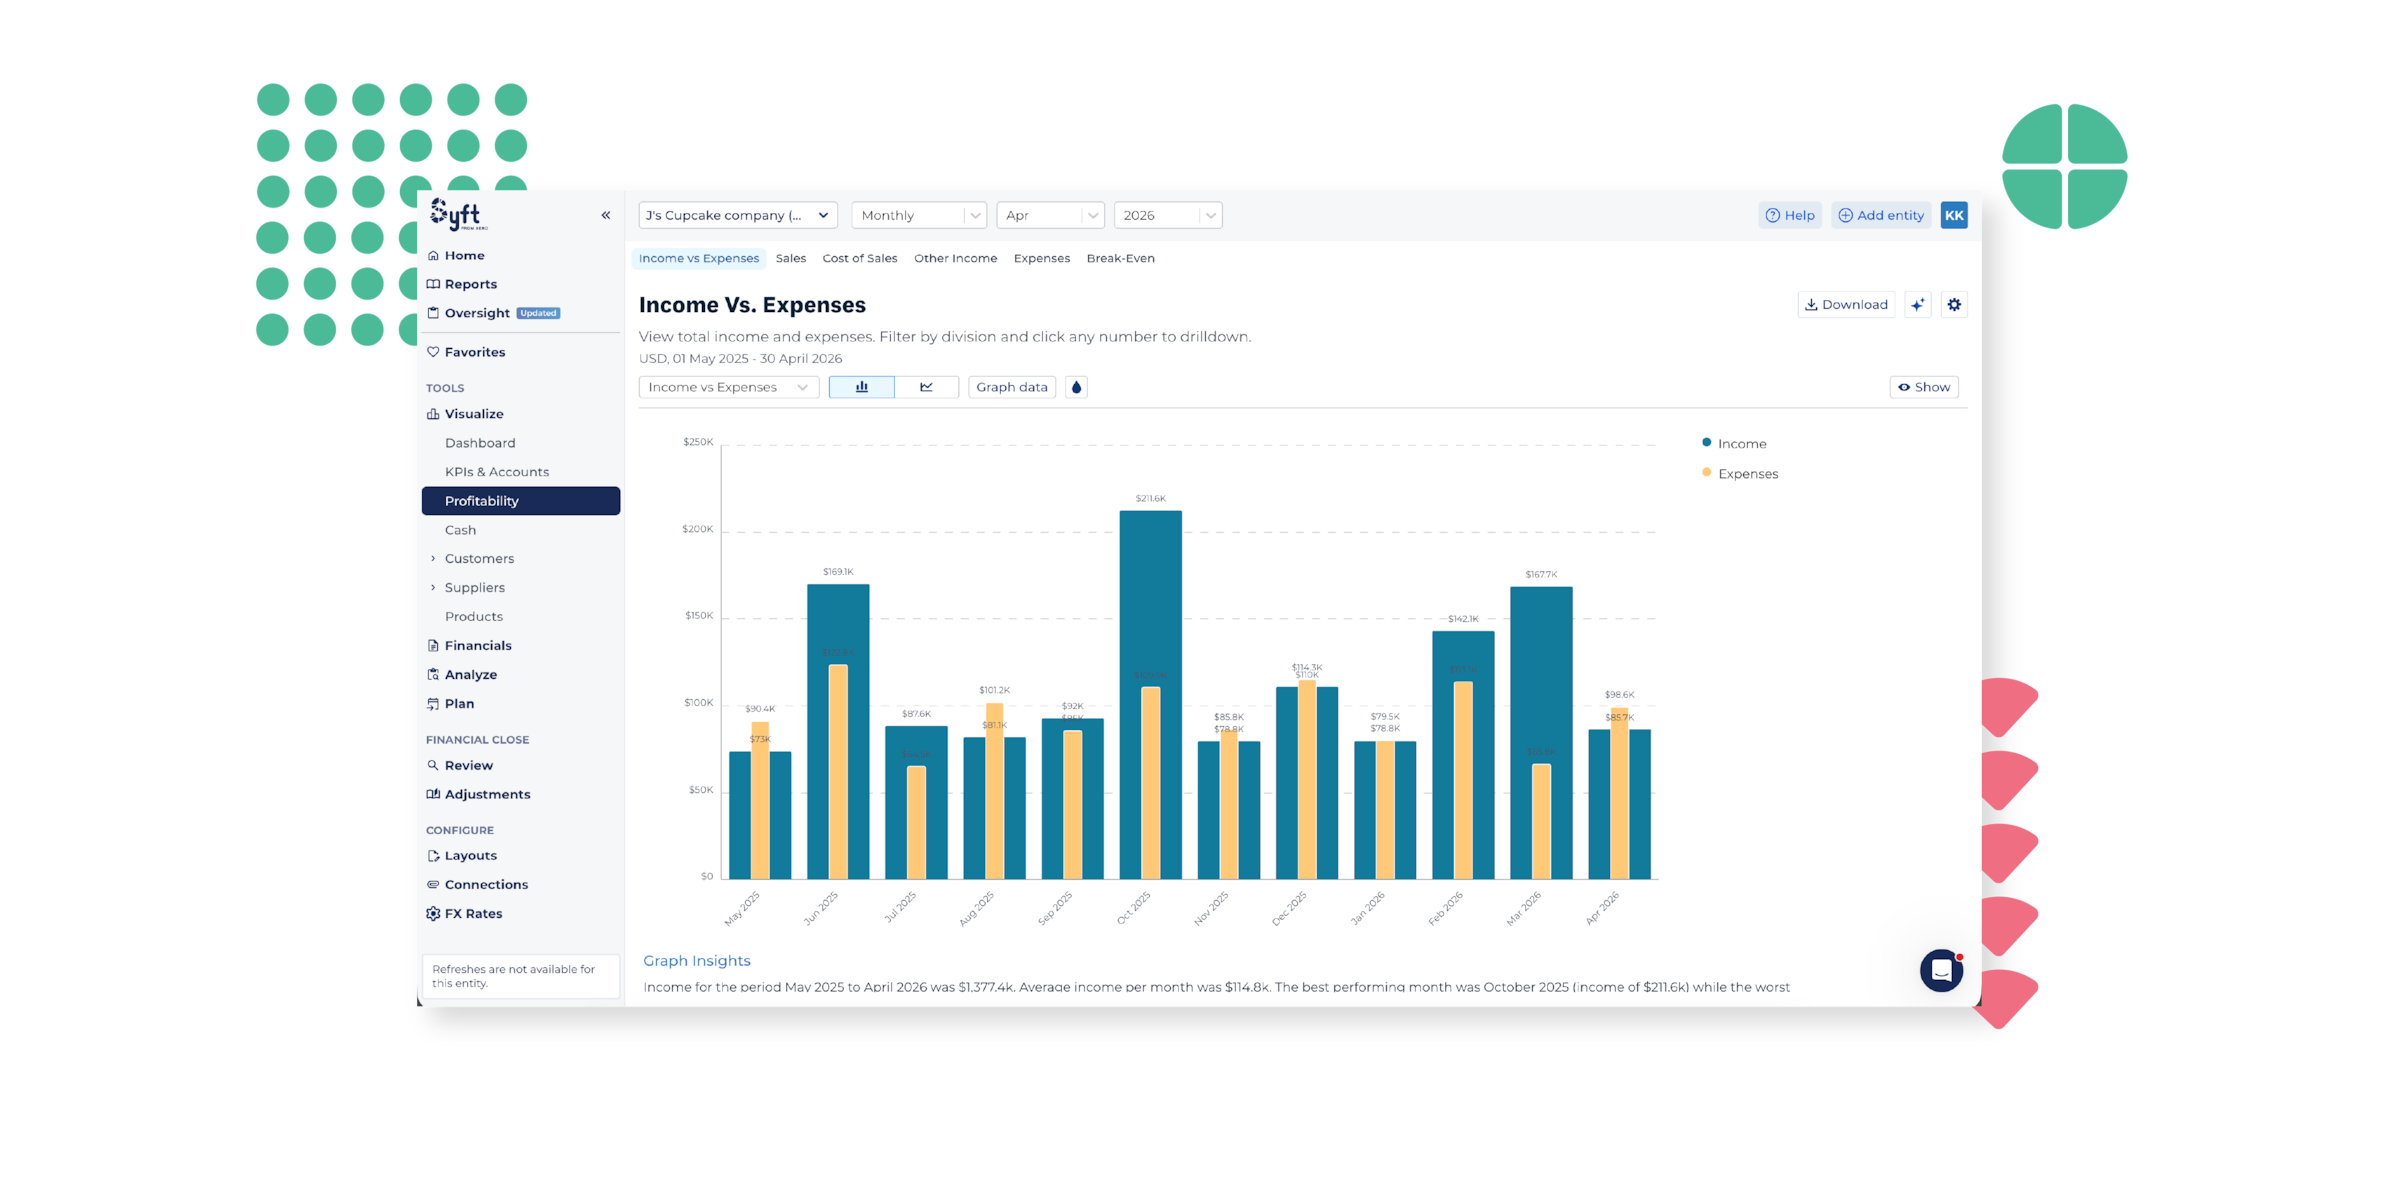
Mat’s favourite Syft feature is the monthly Income and Expenses graph. He loves this colour-coded graph because “it gives [him] a really clear snapshot” of profitability information, especially if he looks over a few years. However, this graph is most powerful when used in conjunction with the equivalent cash graph. As Mat explains:
“The Profit and Loss or Income and Expenses graph tells me what the business has done on paper and then I say to them, ‘This cash version of that same graph tells you how you were feeling in that period.’ Because clients often feel good or better or worse depending on their bank account.”
Oftentimes, clients think everything is better if their bank account is up. However, they might not be making more profit and the profit is going down. Showing the two graphs side-by-side in a dashboard illustrates how they were feeling versus what was going on in their business.
Creating consolidations
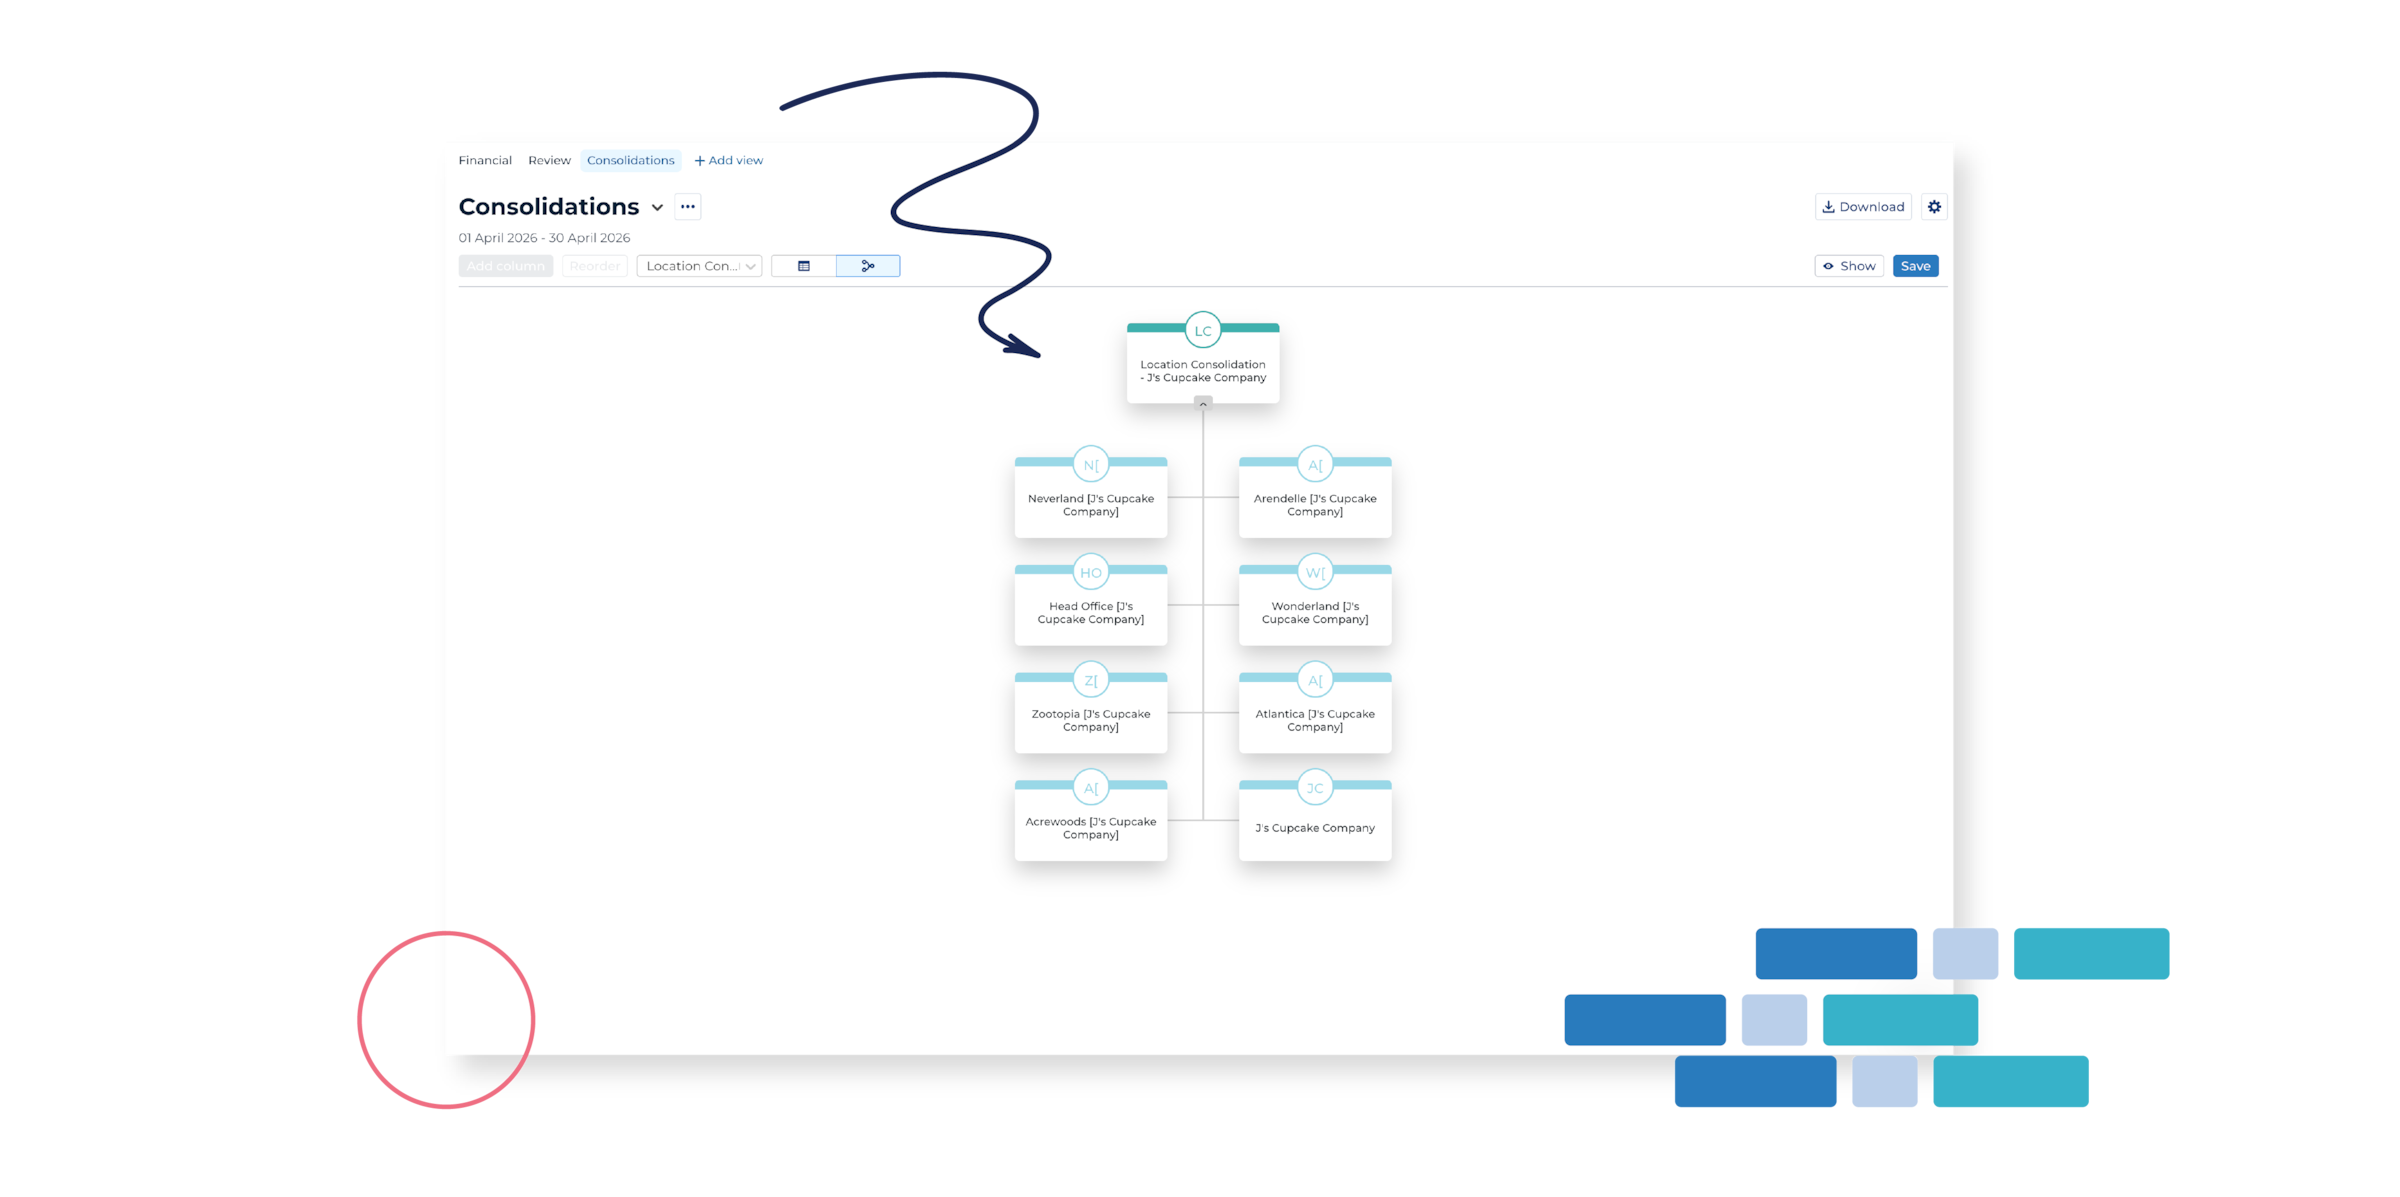
Syft has also helped the teams create consolidations much more easily. Instead of spending hours manually consolidating Xero files, they can now create consolidations in a fraction of the time and provide a neat multi-entity snapshot from Syft.
“Now, I've automatically got a consolidated picture so I can give the client a snapshot straight away.”
Finding the right report format for each client
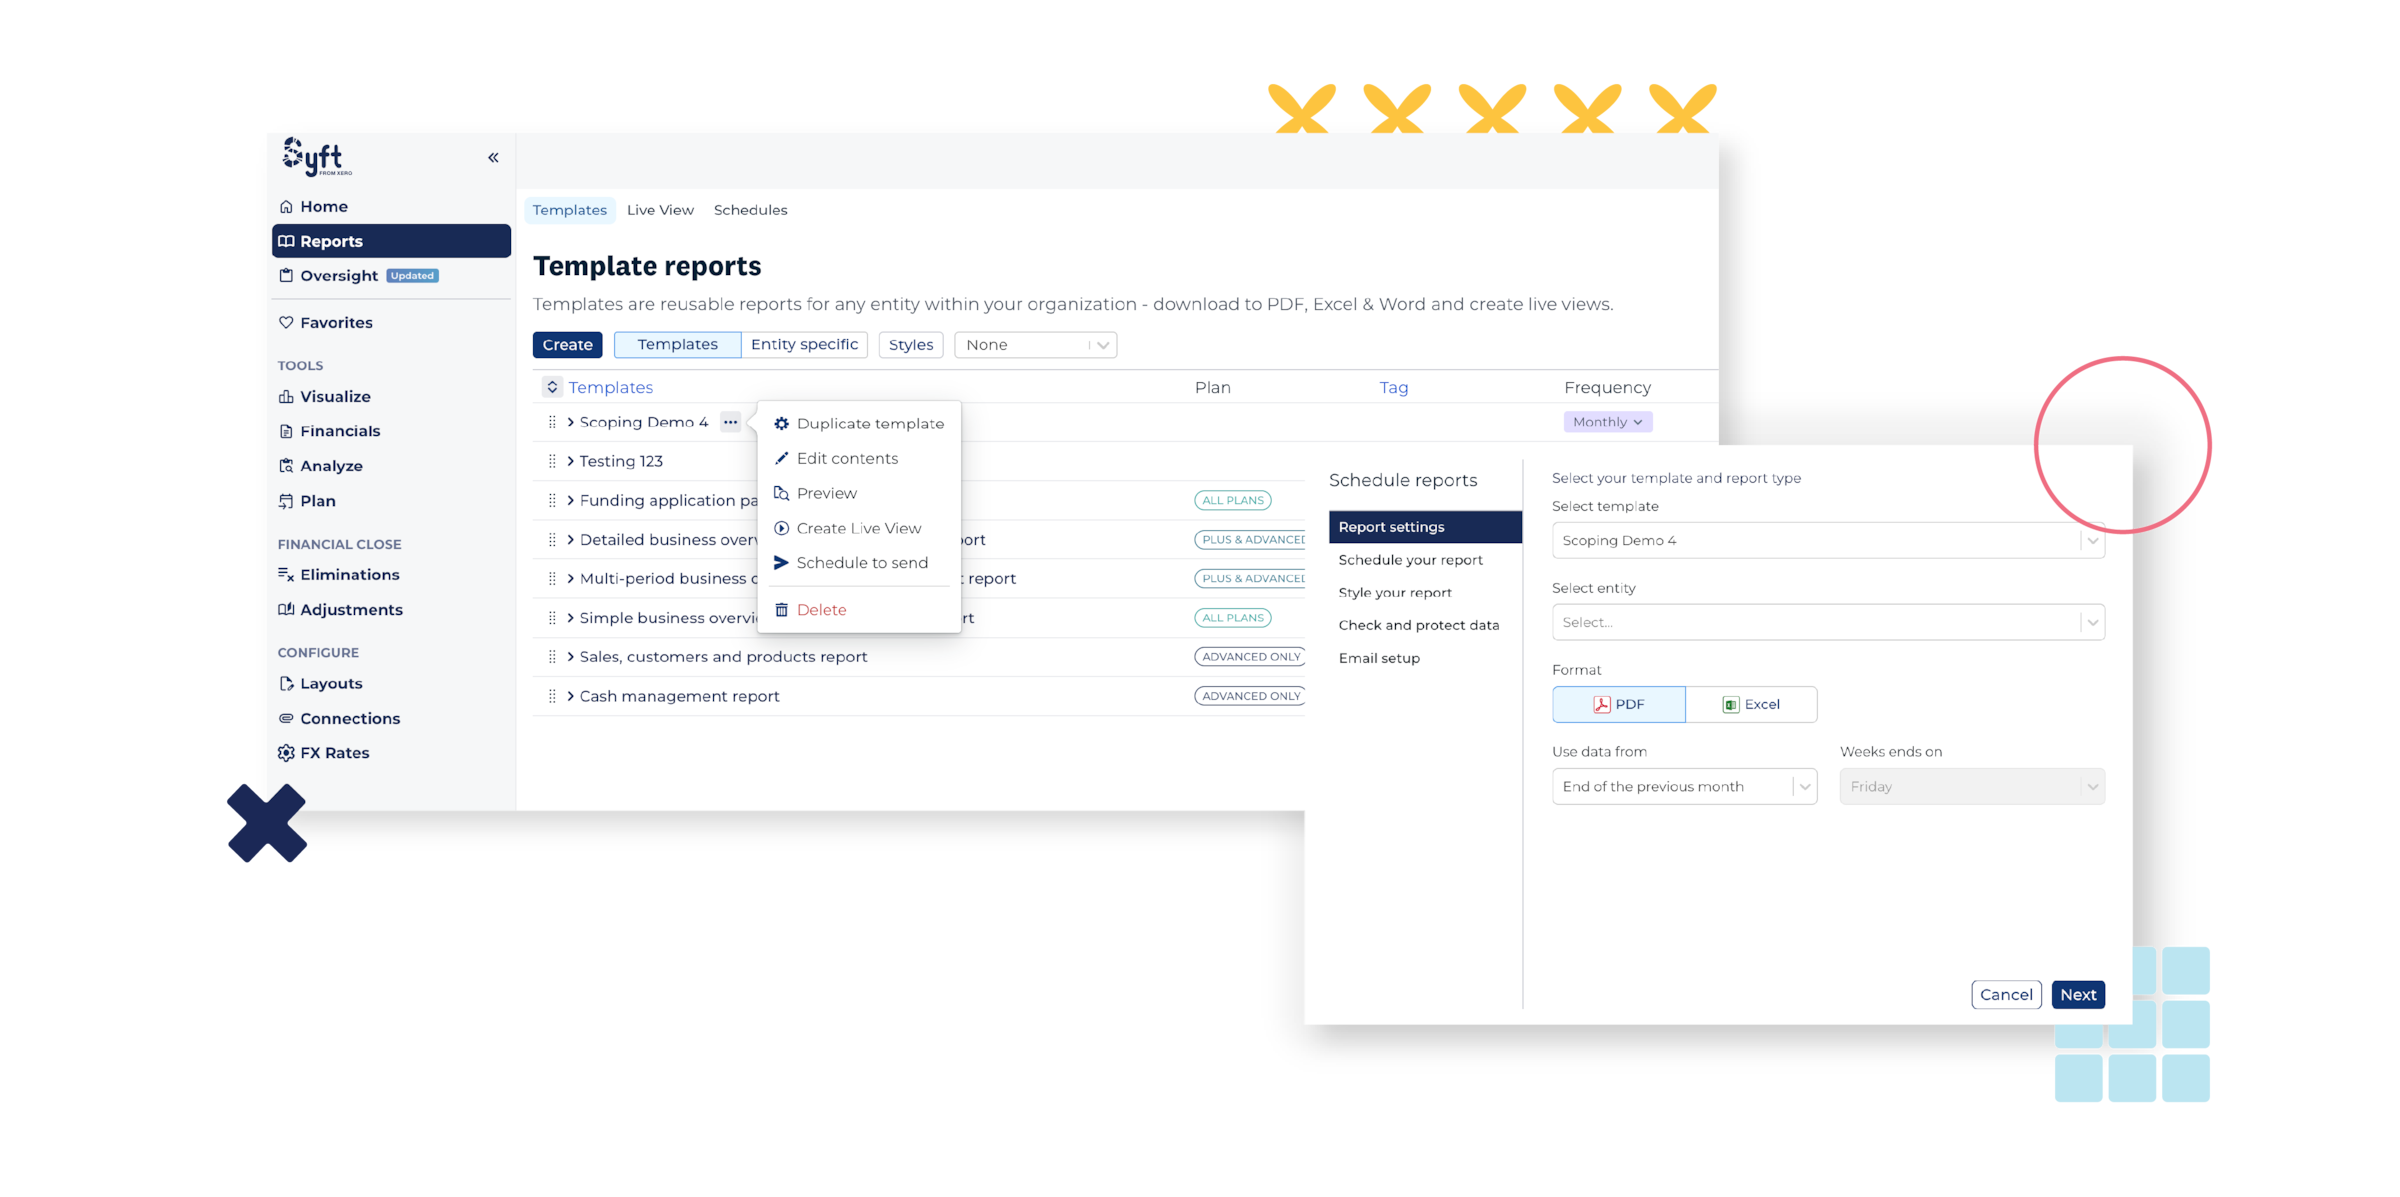
One of the elements of Syft that the Huddle team finds helpful is the ability to share reports in different formats – PDF, Excel, Word or Live View – a hosted URL that updates in real-time. While some clients love the Live View option, most prefer the PDF format. Mat also likes the PDF options, as it gives him the opportunity to do a solid quality check before sharing it with the rest of the team. However, the ability to share in various formats means he can share information with clients in the configuration they prefer.
Improving client conversations
For Mat, the biggest win of using Syft is that “it creates good conversations with clients.” For example, his one client in food manufacturing is fantastic at their job, but usually finds accounting difficult to understand. Thanks to its intuitive visualisations, Syft has empowered them to discuss their financials with confidence.
“A page of numbers doesn't mean a lot to them. They ask, ‘What am I seeing? What does it mean?’ But I can show them a picture in Syft of a time series of income compared to last year and it gives them something that they can understand and talk about… I can then use that picture to explain what's happening in their business... So they can see the flow and effect.”
Another Syft success for Huddle is how integral Syft has become to client meetings. Several clients now “ask for it by name.” For instance, one of the advisory boards Mat serves specifically asks for their Syft reports: “It's not called the financial report. They call it the Syft report now.”
Saving time and delivering added value
Previously, it would take the team ±60 minutes to upload all the information needed for an advisory meeting and make sure that it was right. By contrast, the Huddle team can create and check Syft reports in 10-20 minutes.
One of the real time-savers has been the good quality data available in Syft. Now, rather than spending ages cleaning up the data, Mat can simply go into Syft and generate reports, which he knows will be solid. Not only has it cut down the time of preparation but it’s also provided more time for Mat and his team to work with their clients and understand their concerns. Plus, clients are prepared to pay more for the added value.
“Clients want to use a lot of the tools in Syft to help them drive business decisions, and they are happy to pay extra because they see the value in it.”
Real client impact
Mat has a client he meets in the middle of each month to discuss what has happened in the past month, as well as where he’s at in the current month. In the last month, this client was below their revenue target. Mat showed them the story behind this result. The client was then equipped to raise these issues with their team and implement a strategy to close the gap.
“They were really proud to come back at the end of the month and say that that mid-month meeting using Syft gave them the motivation to go and push the team to get their goal. They exceeded their sales goal by the end of the month because they had some really clear information and understood what was needed to get the profitability and the sales targets.”
Looking toward the future
While many accountants are concerned by the developments in AI, Mat is confident that it won’t replace accountants who are in the advisory space. As he says:
“If you're already in an advisor space and having good conversations with clients, it's just going to enhance that relationship and there's still going to be an even bigger need for people to have good relationships and good communication.”
And Syft is key to that conversation. In the future, Mat plans to explore other features, such as the Valuation tool, to help clients understand their business’s potential value. Considering the role Syft has played in his practice, Mat encourages other accounting practices to give it a try, especially if they are already part of the Xero ecosystem.
Get one month free
Purchase any Xero plan, and we will give you the first month free.