Break-even point formula
Learn the break-even point formula, how to calculate it in units and revenue, and how to use it to price and plan.
November 2023 | Published by Xero
Published Wednesday 30 September 2026
Table of contents
Key takeaways
- The break-even point is where your total revenue equals your total costs. Every sale past that point adds profit.
- To find break-even in units, divide fixed costs by the contribution margin per unit. To find it in revenue, divide fixed costs by the contribution margin ratio.
- Split semi-variable costs into their fixed and variable parts before you calculate. Keep every input in the same period, whether that’s a month or a year.
- You can lower your break-even point by raising prices, cutting variable costs, trimming fixed costs or selling more higher-margin products. Revisit the calculation whenever your costs or prices change.
What is the break-even point?
The break-even point is where total revenue equals total costs, so there’s no profit or loss. Past that point, each sale adds profit.
Think of it as the waterline for your business. Below it, your sales are still paying off costs like rent and wages. Once you cross it, the money from each extra sale lands in profit.
The break-even point formula tells you exactly where that line sits, either in units sold or in revenue. With that number, you can set prices and sales targets before you commit any money.
Break-even point formulas
You can express the break-even point in units (sometimes called volume) or in revenue. Both formulas use the same inputs, as set out in OpenStax Principles of Managerial Accounting.
Break-even point in units
This formula shows how many products or service hours you need to sell to cover your costs.
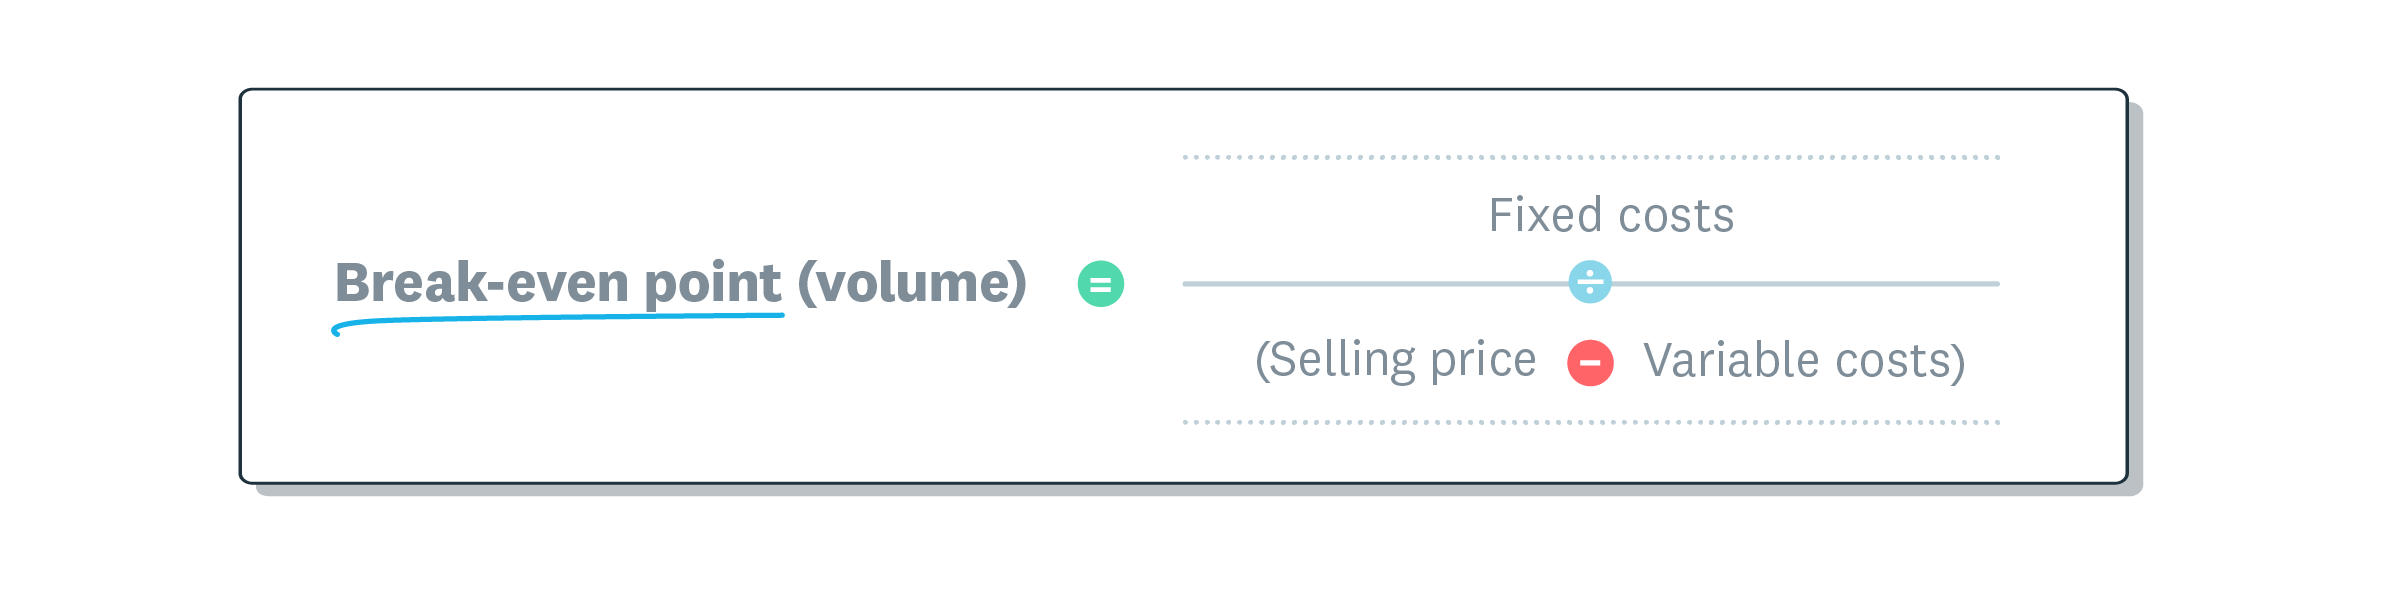
Break-even point (units) = Fixed costs ÷ (Selling price per unit – Variable cost per unit)
The part in brackets is your contribution margin per unit. It’s what each sale puts towards your fixed costs once its own variable costs are paid.
Break-even point in revenue
This formula shows how much money you need to bring in to cover your costs. It’s handy when you sell many items at different prices.
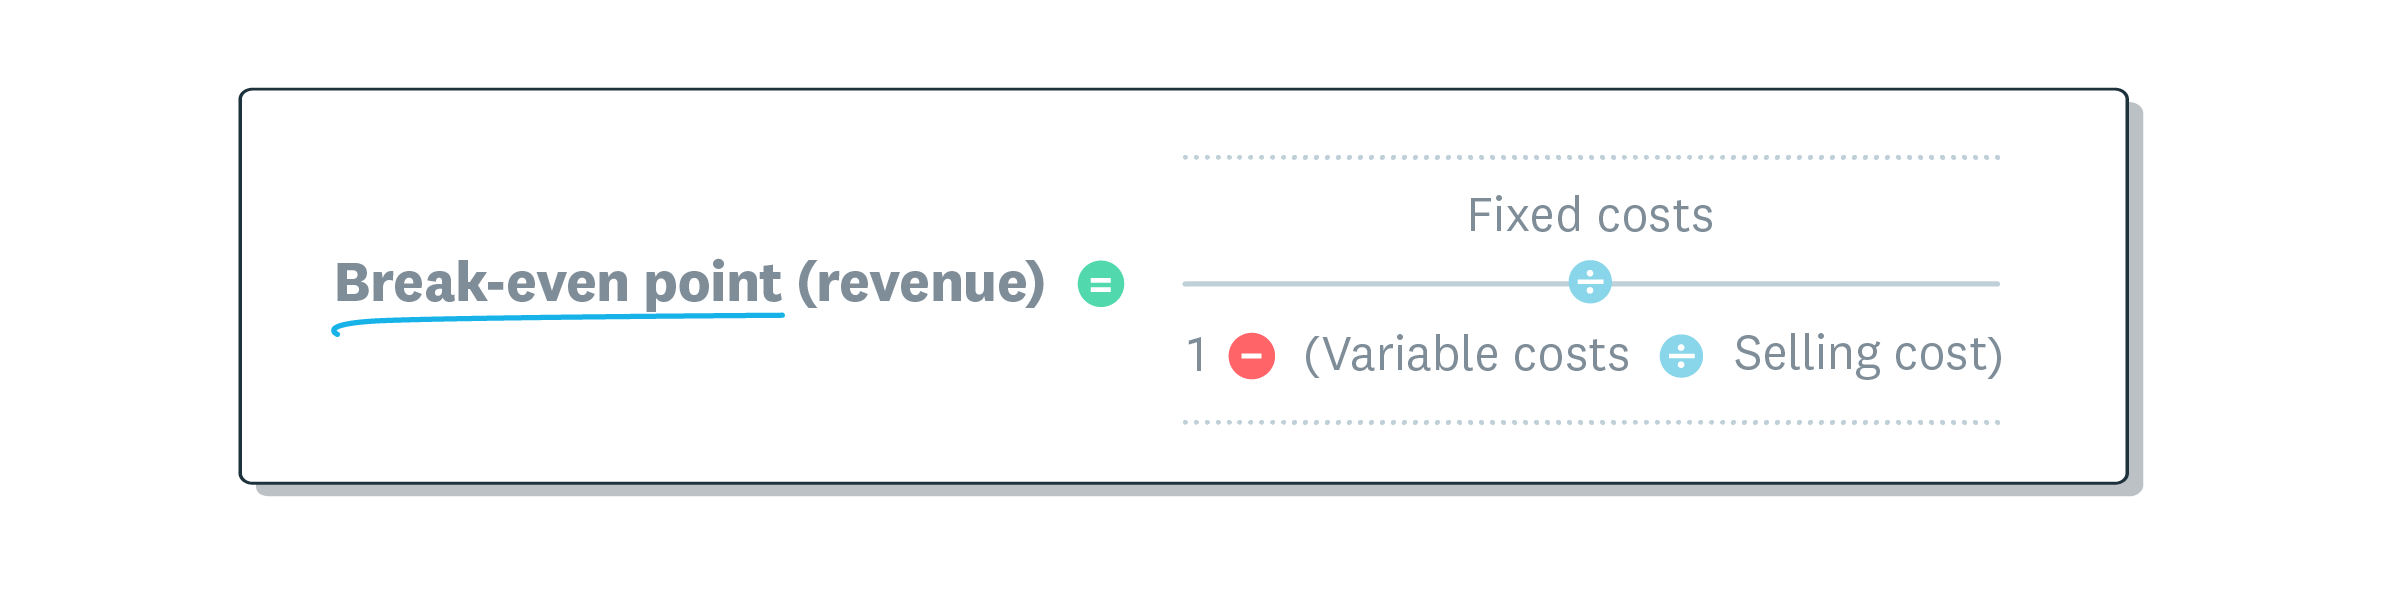
Break-even point (revenue) = Fixed costs ÷ Contribution margin ratio
You can also write it in the longer form below. Keep the outer square brackets, because without them the order of operations gives you the wrong answer.
Break-even point (revenue) = Fixed costs ÷ [1 – (Variable cost per unit ÷ Selling price per unit)]
Contribution margin and contribution margin ratio
Both formulas depend on contribution margin, which is the amount of each sale left over after variable costs. The ratio shows that same amount as a share of the selling price.
Contribution margin per unit = Selling price per unit – Variable cost per unit
Contribution margin ratio = (Selling price per unit – Variable cost per unit) ÷ Selling price per unit
Contribution margin comes before fixed costs, while your overall profit margin accounts for those costs too. The higher your contribution margin, the fewer sales you need to cover your fixed costs.
What you need to calculate break-even
Before you use either formula, sort your costs by how they behave when sales change. Your fixed costs stay put each month, while your variable costs move with every sale.
Here’s how each input breaks down, with common examples for a small business.
- Fixed costs stay the same regardless of sales, such as rent, insurance, salaries and software subscriptions
- Variable costs rise and fall with each sale, such as raw materials, packaging, hourly contractor labour and payment fees
- Semi-variable costs combine a fixed base with a usage-based part, such as phone, fuel, power and repairs
- Selling price per unit is what a customer pays for one product or one hour of service
Semi-variable costs need one extra step. The U.S. Small Business Administration (SBA) recommends splitting them into their fixed and variable parts. For example, a phone plan’s monthly fee is fixed, while charges for extra usage are variable.
How to calculate the break-even point
Once your costs are sorted, you can work out your break-even point in a few minutes. Follow these steps for either formula.
1. Add up your fixed costs
Total every cost you pay regardless of sales for one period, usually a month. Include the fixed part of any semi-variable costs.
2. Work out your variable cost per unit
Add up the costs tied to making or delivering one unit, such as materials and packaging. For a service business, the unit is often one billable hour.
3. Calculate your contribution margin
Subtract the variable cost per unit from your selling price. To get the contribution margin ratio, divide that result by the selling price.
4. Divide fixed costs by the contribution margin
Divide fixed costs by the contribution margin per unit to get break-even in units. Divide fixed costs by the contribution margin ratio to get break-even in revenue. To check your work, multiply the units result by the selling price and confirm it matches.
Break-even point examples
These two examples show the formulas at work, one for a product business and one for a service business. Both use monthly figures.
Product-based example: kombucha brewery
A small kombucha brewery has fixed costs of $6,000 a month. Each bottle costs $2 to produce and sells for $7.
That gives a contribution margin of $7 – $2 = $5 per bottle. The contribution margin ratio is $5 ÷ $7, or about 71.4%.
Break-even point (units) = $6,000 ÷ $5 = 1,200 bottles
Break-even point (revenue) = $6,000 ÷ (5 ÷ 7) = $8,400
To break even, the kombucha brewery must sell 1,200 bottles and bring in $8,400 a month. Using the exact fraction 5/7 avoids a rounding error, and the result checks out: 1,200 × $7 = $8,400.
Service-based example: graphic designer
A graphic designer has fixed costs of $2,700 a month, covering utilities, hardware leases, software subscriptions and advertising. The designer pays a contractor $35 an hour and charges clients $75 an hour.
That gives a contribution margin of $75 – $35 = $40 per hour. The contribution margin ratio is $40 ÷ $75, or about 53.3%.
Break-even point (hours) = $2,700 ÷ $40 = 67.5 hours
Break-even point (revenue) = $2,700 ÷ (40 ÷ 75) = $5,062.50
To break even, the graphic designer must bill 67.5 hours and earn $5,062.50 a month. That matches 67.5 × $75 = $5,062.50.
Break-even point for multiple products
If you sell more than one product, use a weighted average contribution margin based on your sales mix. Your sales mix is the share of total units that each product makes up.
Say 60% of your unit sales come from product A, which sells for $10 and has a $4 variable cost. The other 40% come from product B, which sells for $5 and has a $3 variable cost.
Weighted contribution margin = (0.6 × $6) + (0.4 × $2) = $4.40
With fixed costs of $8,800, you divide $8,800 by $4.40 to get 2,000 units. At your sales mix, that’s 1,200 units of product A and 800 units of product B.
To check, (1,200 × $6) + (800 × $2) = $8,800, which covers your fixed costs exactly. If your mix shifts towards the lower-margin product, your break-even point rises.
Monthly vs annual break-even point
The formula stays the same whether you calculate monthly or annually, but every input must cover the same period. Mixing annual rent with a monthly sales target will throw out your result.
For the kombucha brewery, annual fixed costs are $72,000. Dividing $72,000 by the $5 contribution margin gives 14,400 bottles a year.
Seasonal businesses can break even over a full year but still lose money in some months. A cash flow forecast helps you plan ahead so you can cover costs when sales dip.
Why break-even analysis matters for small businesses
Knowing your break-even point turns guesswork into clear targets. Here’s how it helps with everyday decisions.
- Set prices that cover your costs and leave room for profit
- Turn your fixed costs into a clear monthly sales target
- Catch overlooked costs as you list everything out
- Test whether you can afford a new hire or an expansion
- Show lenders and investors you understand your numbers
That last point carries weight. The SBA notes that investors and lenders usually require break-even analysis, so have yours ready before you apply for funding.
Your break-even figure also lets you measure your margin of safety. It shows how far sales can fall before you reach break-even.
Margin of safety = (Current sales – Break-even sales) ÷ Current sales
If the kombucha brewery sells 1,500 bottles, it brings in $10,500. Its margin of safety is ($10,500 – $8,400) ÷ $10,500 = 20%, so sales could drop by a fifth before losses start.
How to lower your break-even point
A lower break-even point means you reach profit sooner each month. You can bring it down by changing the numbers that feed the formula.
- Charge more where the value you offer supports it
- Cut variable costs by negotiating with suppliers or reducing waste
- Trim fixed costs that don’t help you win or keep sales
- Sell more of your higher-margin products
Each change works on a different part of the formula. Higher prices and lower variable costs widen your contribution margin, while lower fixed costs shrink the amount you need to cover.
A price rise lands best when customers understand the value behind it. Plan how you’ll explain new rates before you raise prices, so regular customers hear it from you first.
Limitations of break-even analysis
Break-even analysis assumes your selling price and variable cost per unit stay the same at every sales level. According to OpenStax Principles of Managerial Accounting, overlooking the relevant range for your cost assumptions, or the real market demand for your product, distorts the results. That can lead you to make more stock than customers will buy.
In practice, costs shift as you grow. Your marginal cost of producing one more unit can fall with bulk buying or rise when you pay overtime.
Treat your break-even point as a planning estimate. Revisit it whenever your costs or prices change, and pair it with real sales data to see what customers will actually buy.
Track your break-even numbers with Xero
Accurate cost records give you a break-even point you can rely on. With Xero, you can sort fixed and variable costs as bank transactions come in, then run reports to compare your sales with your break-even target. Try Xero today and get one month free.
FAQs on the break-even point formula
These answers cover common questions about using the break-even point formula in your business.
Can I calculate the break-even point in Excel or Google Sheets?
Yes, both work. Type the formula into a cell, or use Excel’s Goal Seek tool to find the sales volume that brings profit to zero.
What happens after I pass the break-even point?
Each extra sale adds its full contribution margin to profit. For the kombucha brewery, bottle 1,201 adds $5 of profit because fixed costs are already covered.
How often should I recalculate my break-even point?
Recalculate it whenever a major cost or price changes, such as a rent increase or new supplier rates. A monthly check alongside your profit and loss report keeps your sales targets current.
Does the break-even point formula work for service businesses?
Yes, if you use a billable hour or an average project as your unit. Treat only delivery costs, such as contractor fees, as variable.
What is a good margin of safety?
The right margin of safety depends on how steady your sales are. A business with seasonal or uneven sales usually benefits from a bigger buffer than one with regular contracted income.
Related terms
Learn more about break-even point formula
Handy resources
Advisor directory
You can search for experts in our advisor directory
How to increase revenue
Find out how businesses grow their sales income.
Stay on top of your numbers with Xero
Accounting software tracks your performance while you sleep.
Disclaimer
This glossary is for small business owners. The definitions are written with their requirements in mind. More detailed definitions can be found in accounting textbooks or from an accounting professional. Xero does not provide accounting, tax, business or legal advice.