Liquidity ratios explained: types, formulas and examples
Learn how liquidity ratios help your small business measure cash flow and find ways to improve it.

Written by Jotika Teli—Certified Public Accountant with 24 years of experience. Read Jotika's full bio
Published Monday 20 April 2026
Table of contents
Key takeaways
- Calculate all three liquidity ratios (cash, quick, and current) regularly to get a complete picture of your short-term financial health, since each one measures a different level of financial flexibility.
- Track your liquidity ratios monthly and compare them against industry benchmarks to spot cash flow problems early, before they become a crisis.
- Use your ratios to guide spending decisions: a low current ratio (below 1.5) suggests cutting costs or financing purchases with loans, while a high ratio (above 3.0) signals an opportunity to reinvest idle cash into growth.
- Speed up cash coming in and slow down cash going out by automating invoices, offering early payment discounts, and negotiating longer payment terms with suppliers to improve your liquidity position.
What is liquidity?
Liquidity is the cash your business has available to pay bills right now. This includes money in the bank plus anything you can quickly convert to cash, such as short-term investments.
Understanding liquidity is essential for business survival. Why liquidity matters:
- Cash flow problems cause 82% of business failures
- Poor liquidity management causes overspending or missed growth opportunities, a growing risk considering the accrual of tax debt for Australian businesses increased from A$26.5 billion in 2019 to A$44.8 billion in 2022.
- Liquidity ratios show your short-term financial health (12 months or less)
Understanding your liquidity helps you decide how to manage operations, expenses and investments.
What are liquidity ratios?
Liquidity ratios measure your ability to pay short-term debts using cash and near-cash assets. They show the gap between what you have and what you owe.
There are three main liquidity ratios, each measuring a different aspect of your financial flexibility. The three main liquidity ratios are:
- Cash ratio: measures using only cash and cash equivalents
- Quick ratio: measures using cash plus assets convertible within 90 days
- Current ratio: measures using all assets convertible within 12 months
If you use accounting software like Xero, you can click to view your quick ratio at any time.
Why liquidity ratios matter
Liquidity ratios help you make confident financial decisions by showing whether you can pay your bills when they're due. They're essential for small business survival and growth.
Here's why tracking these ratios matters:
- Prevent cash flow crises: liquidity ratios give you early warning of cash flow problems
- Make informed spending decisions: know whether you can afford new equipment, staff, or inventory before committing
- Satisfy lenders and investors: banks and investors often require liquidity ratios when assessing loan applications or investment opportunities
- Benchmark your performance: compare your ratios against industry standards to see how your business stacks up
- Plan for seasonal changes: track ratio trends to prepare for slow periods before they affect your cash position
Types of liquidity ratios
Each liquidity ratio measures a different level of financial flexibility. Choose based on how quickly you need to assess your ability to pay bills:
- Cash ratio (most conservative): uses only cash and cash equivalents
- Quick ratio (moderate): uses cash plus assets convertible within 90 days
- Current ratio (comprehensive): uses all assets convertible within 12 months
Cash ratio
The cash ratio is the most conservative measure of liquidity, focusing only on immediately available funds.
Cash ratio calculation
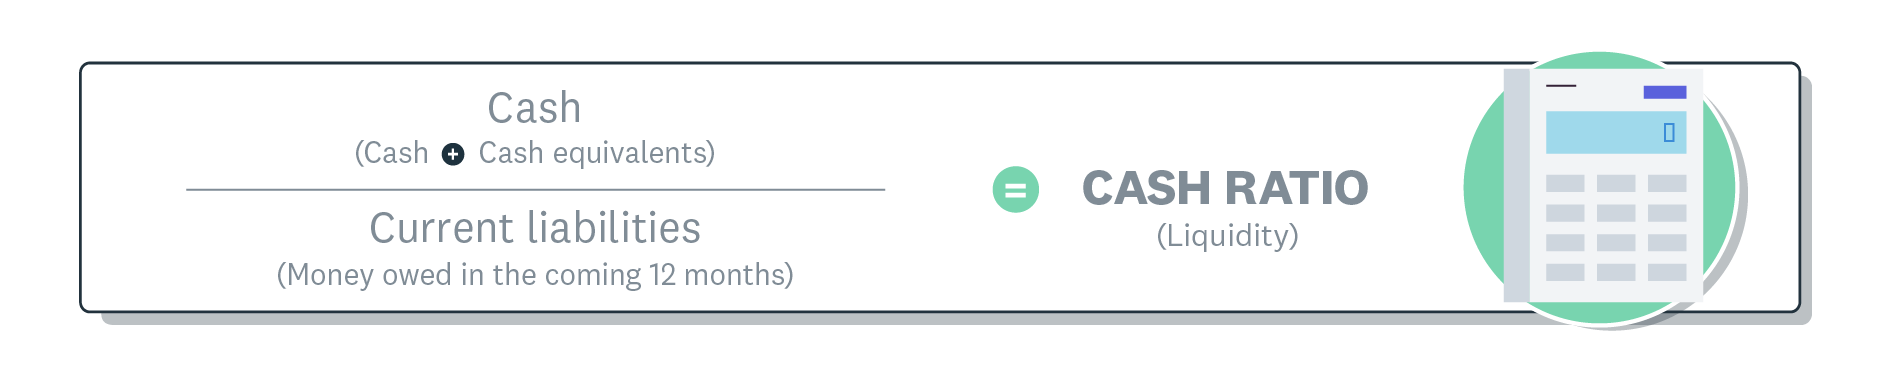
Cash ratio liquidity formula
Cash ratio measures your ability to pay short-term debts using only cash and cash equivalents. This is the most conservative liquidity measure because it only counts money you can access immediately.
The cash ratio answers important questions about your immediate financial position. What it tells you:
- Can you cover payroll with cash on hand?
- Can you pay immediate expenses without selling assets?
- Do you have enough cushion for emergencies?
Cash ratio calculation includes:
- Bank account balances: all business checking and savings accounts
- Cash equivalents: securities convertible to cash within 24–48 hours
Cash ratio calculation excludes:
- Inventory: products waiting to be sold
- Accounts receivable: money customers owe you
- Expected revenue: future sales or payments
Cash ratio example
Say you have $50,000 in cash and $50,000 in stocks. Add them together to get $100,000.
Now find the 'short-term liabilities' line on your balance sheet. This includes upcoming expenses like loan payments, monthly bills, taxes due, and payroll.
- If liabilities are $250,000: $100,000 ÷ $250,000 = 0.4 cash ratio
- If liabilities are $25,000: $100,000 ÷ $25,000 = 4.0 cash ratio
What's a good cash ratio?
A good cash ratio for most small businesses is 0.2 or higher. Different ratio levels indicate different financial positions. Here are the benchmarks:
- 0.2 or higher: adequate cash reserves for most small businesses
- 0.5 or higher: strong cash position with good financial cushion
- Below 0.2: may struggle to pay immediate bills
A low cash ratio doesn't mean failure, but it does require action. If your ratio is low:
- Speed up collections: offer early payment discounts
- Extend payment terms: negotiate longer periods with suppliers
- Build cash reserves: set aside more revenue before spending
When to use the cash ratio
The cash ratio doesn't reflect every situation your business faces. If you've just invested heavily in a new product line, your ratio may be low, but that doesn't mean trouble. It simply means you've chosen to deploy cash for growth.
Use liquidity ratios when making expense decisions. They help you judge when you're running too low on cash.
Here's what the cash ratio offers and its limitations. The cash ratio:
- calculates easily with minimal data
- provides quick insights on cash utilisation
- shows realistic ability to cover short-term expenses using only cash and cash equivalents
However, the cash ratio has limitations. It:
- excludes operating income from the calculation
- ignores how supplier credit terms affect cash on hand
- overlooks long-term expenses or challenges
Quick (acid test) ratio
-calculation-1.1708626946524.png)
Quick ratio liquidity formula Version 1
-calculation-2.1708626946541.png)
Quick ratio liquidity formula Version 2
The quick ratio provides a balanced view of your short-term financial health by including near-cash assets.
Quick ratio calculation
Quick ratio measures your ability to pay short-term debts within 90 days using cash and near-cash assets. This ratio excludes inventory because it can take time to sell.
The quick ratio answers key questions about your short-term financial flexibility. What it measures:
- Can you cover 3 months of expenses without selling inventory?
- Can you pay bills using only liquid assets?
- Is your business financially flexible in the short term?
There are two ways to calculate the quick ratio:
Method 1:
- Add up your cash, marketable securities, and accounts receivable
- Divide by your current liabilities (debts due within 90 days)
Method 2:
- Start with total current assets from your balance sheet
- Subtract inventory and prepaid expenses
- Divide by your current liabilities
Both methods should give you the same result.
Quick ratio example
Say you have $30,000 in the bank, $15,000 in securities, and $60,000 in costs over the next three months. Your quick ratio is 0.75 ($30,000 + $15,000 ÷ $60,000).
The quick ratio is also called an acid test ratio because acid tests are quick and easy to do. Your balance sheet has all the numbers you need.
What's a good quick ratio?
A good quick ratio is 1.0 or higher. Different ratio levels indicate different financial positions. Here are the benchmarks:
- 1.0 or higher: ideal position where you can cover all short-term debts
- 0.8–1.0: adequate liquidity for most situations
- Below 0.8: may struggle with unexpected expenses
Understanding what your quick ratio number means helps you take action. How to interpret your ratio:
- 1.5 ratio: you have $1.50 for every $1 of upcoming expenses
- 1.0 ratio: you have exactly enough to cover short-term debts
- 0.3 ratio: you have only 30 cents for every $1 of bills due
When to use the quick ratio
The quick ratio is particularly useful for comparative analysis. Use the quick ratio to:
- compare your business to others in your industry
- track your liquidity over different periods
- evaluate companies you're thinking of investing in
Don't rely on this ratio for long-term planning. A high quick ratio after a great launch might look healthy, but it won't show whether your product has staying power.
Here's what the quick ratio offers and its limitations. The quick ratio:
- calculates easily with balance sheet data
- shows whether you can cover expenses over the short term
- helps compare cash flow between periods for shortage planning
- reveals if you can afford more expenses or investments
However, the quick ratio has limitations. It:
- excludes operating income from the calculation
- covers only a short-term (three-month) period
- struggles to account for volatile securities that change value quickly
- may be inaccurate if you overstate accounts receivable value
Current (working capital) ratio
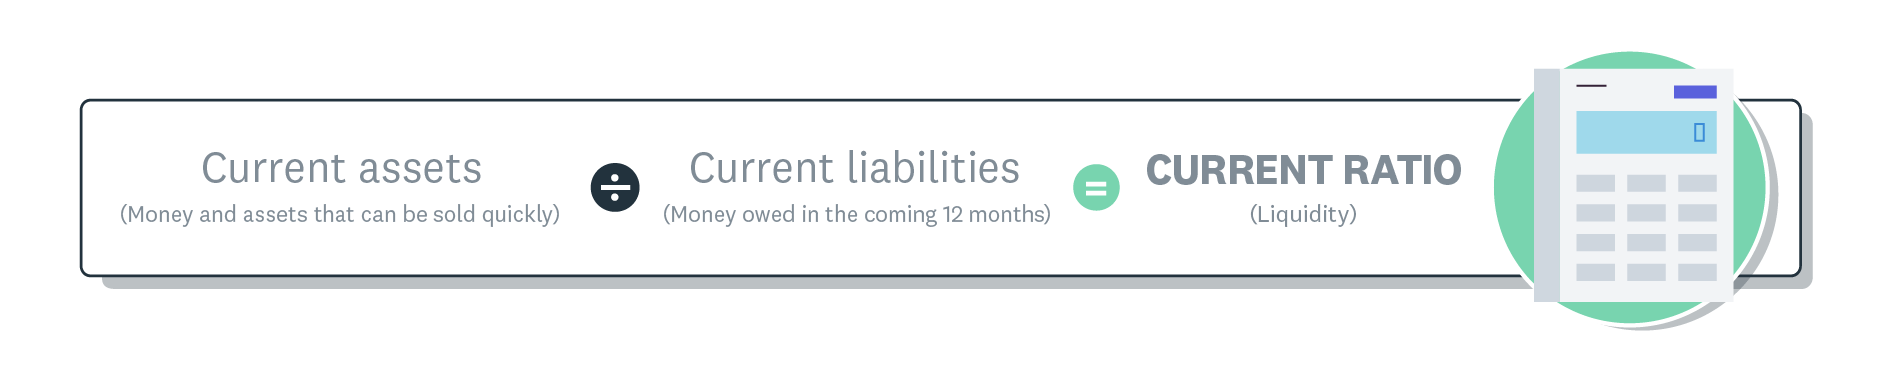
Current ratio liquidity formula
The current ratio gives you the broadest view of your ability to meet short-term obligations.
Current ratio calculation
Current ratio measures your ability to pay debts due within 12 months using all current assets. This includes cash, inventory, accounts receivable, and other assets you can convert to cash within a year.
The current ratio has another common name. Why it's called the working capital ratio:
- Working capital equals current assets minus current liabilities
- Shows sustainability over the next 12 months
- Includes inventory unlike the quick ratio
Find the numbers on your balance sheet. Look for total current assets near the top and total current liabilities near the middle. Focus only on current items, not long-term assets or liabilities.
Unlike the quick ratio, the current ratio includes inventory at its balance sheet value. This is typically the cost you paid, not the selling price.
If your inventory is worth less than it cost (such as out-of-season stock), adjust its value on the balance sheet for a more accurate ratio.
Your current liabilities include all bills due within 12 months. The way you do your bookkeeping affects how these appear on your balance sheet.
If you don't record monthly bills until they clear your bank, they won't show on your balance sheet. An accountant or your bookkeeping software support team can help you set up your books correctly.
Current ratio example
Here's an example calculation. Say you have:
- $25,000 in inventory
- $30,000 in bank accounts
- $10,000 in accounts receivable
- $5,000 in prepaid expenses
- $2,000 in short-term investments
Total current assets: $72,000. Your balance sheet shows this total in the current assets section.
Now find current liabilities (accounts payable, payroll, taxes, short-term loans):
- If liabilities are $100,000: $72,000 ÷ $100,000 = 0.72 current ratio
- If liabilities are $72,000: $72,000 ÷ $72,000 = 1.0 current ratio
As your bills decrease relative to assets, your ratio increases.
What's a good current ratio?
A good current ratio for most small businesses is 1.5–2.0, and experts note that a generally accepted ratio is 2:1, with current assets twice the value of current liabilities. Different ratio levels indicate different financial positions. Here are the benchmarks:
- 1.5–2.0: ideal range for most small businesses
- 1.0–1.5: acceptable but monitor closely
- Below 1.0: needs immediate attention as it can reduce opportunities
- Above 3.0: may indicate missed growth opportunities
When to use the current ratio
Use the current ratio to guide spending decisions:
- Low ratio (below 1.5): consider cutting expenses or financing equipment purchases with loans instead of cash
- High ratio (above 3.0): consider reinvesting idle cash, investments, or inventory into growth
This ratio is useful but not the only number to consider. Seasonal businesses should use additional metrics to assess short-term bill coverage.
The current ratio only looks at current assets and liabilities. It doesn't account for long-term profitability, loan types, or other factors affecting your business.
Here's what the current ratio offers and its limitations. The current ratio:
- calculates easily with just two balance sheet numbers
- reveals cash flow issues quickly
- shows your ability to cover expenses
- signals when you need loans or can afford to invest
However, the current ratio has limitations. It:
- skews easily when either number changes
- hides seasonal trends and cash flow fluctuations
- covers only short-term health (12 months or less)
- excludes insights on loans, profitability, and long-term challenges
Using liquidity ratios
Liquidity ratios work best when you use them consistently and interpret them in context.
Regular calculation ensures accurate tracking. Calculate consistently:
- Check monthly: calculate ratios at the same time each month, though businesses with ten or more daily cash flow transactions may need their short-term liquidity managed daily and monitored often.
- Track trends: review changes over time, not just single measurements, and consider developing your cash flow forecast on at least a twelve month rolling basis to better identify possible liquidity risks.
- Account for cycles: adjust for seasonal business fluctuations
Context matters when reading your ratios. Interpret wisely:
- Know limitations: no single ratio tells the complete story
- Compare benchmarks: understand what's normal for your industry
- Analyse broadly: include profitability and efficiency ratios
Expert advice can help with complex decisions. Get professional guidance:
- Consult advisors: work with financial professionals for high-stakes decisions, as accountants can provide crucial help during financial restructuring through tools like three-way and cash flow forecasts.
- Automate tracking: use accounting software to calculate and monitor ratios
How to improve liquidity
Improving liquidity requires managing both cash coming in and cash going out. Several approaches can help you improve your liquidity position. Here are practical strategies:
Getting paid faster improves your cash position. Speed up cash inflow:
- Automate invoicing: use accounting software for invoicing and payment reminders
- Offer early payment discounts: encourage faster customer payments
- Improve collections: send automated payment reminders
Controlling when you pay helps preserve cash. Manage cash outflow:
- Negotiate payment terms: extend supplier payment periods
- Cut unnecessary expenses: eliminate non-essential spending
- Lease instead of buy: preserve cash for operations
Operational changes can free up cash. Optimise operations:
- Manage inventory levels: keep stock at industry standards
- Sell unproductive assets: convert unused equipment to cash
- Increase sales efficiency: focus on high-margin products
Your accountant can help you make these decisions. Find experienced accountants and bookkeepers in the Xero advisor directory.
Another metric for liquidity: days sales outstanding
Days sales outstanding (DSO) measures how long it takes to collect payment after a sale. This metric is most useful if you sell on credit or rely heavily on customer invoices.
The days sales outstanding formula
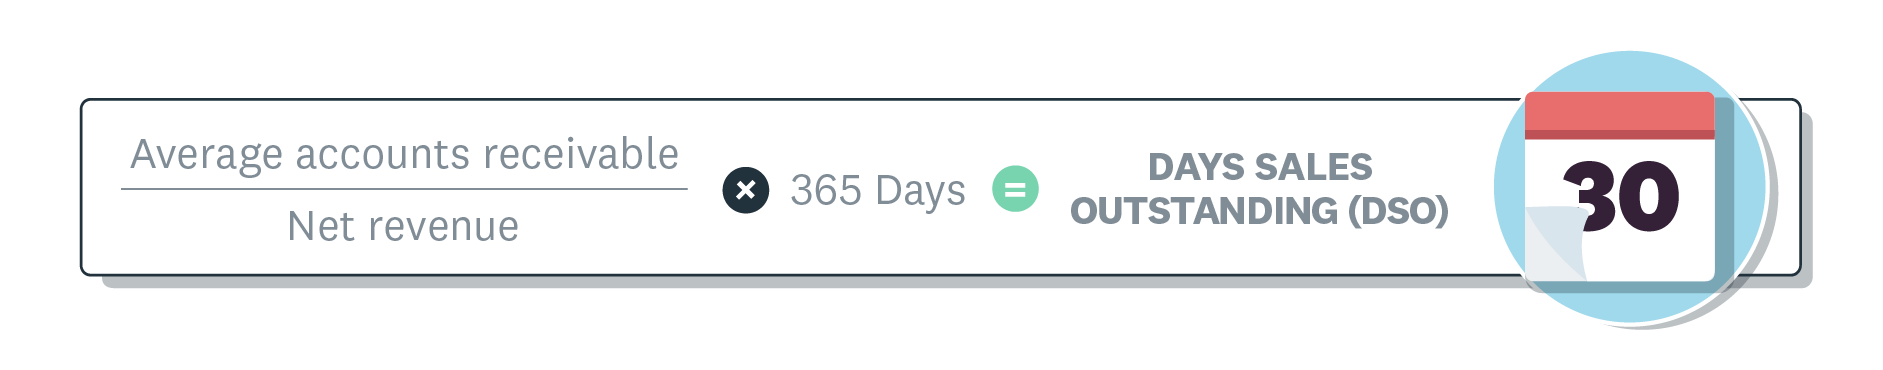
The days sales outstanding formula
DSO shows the average number of days it takes to get paid after a sale. To calculate it, divide your average accounts receivable by your revenue per day.
A lower DSO means faster cash collection. If your DSO is higher than your payment terms (for example, 45 days when you offer 30-day terms), focus on getting clients to pay faster.
Manage your business finances with confidence
Understanding your liquidity ratios helps you make smarter financial decisions. Calculate and analyse these numbers regularly to get a clear picture of your ability to cover short-term debts.
With Xero, you can generate the reports you need to calculate these ratios and stay on top of your finances. See how Xero can simplify your financial management. Get one month free.
FAQs on liquidity ratios
Small business owners often ask these questions about liquidity ratios.
What are the five liquidity ratios?
The five liquidity ratios are: cash ratio, quick ratio, current ratio, operating cash flow ratio, and days sales outstanding (DSO). For most small businesses, the first three provide a solid understanding of liquidity.
Is 2 a good liquidity ratio?
Yes, a current ratio of 2 is generally considered healthy. It means you have $2 of current assets for every $1 of current liabilities. However, the ideal ratio depends on your industry. A very high ratio might suggest you're not using assets efficiently.
What does a liquidity ratio of 2.5 mean?
A current ratio of 2.5 means you have $2.50 in current assets for every $1 of current liabilities. This indicates a strong position with significant cushion to cover short-term obligations.
How often should I calculate liquidity ratios?
Calculate your liquidity ratios monthly. This lets you track trends over time and spot potential cash flow issues early. Calculate at the same time each month for the most consistent view.
Can liquidity ratios predict cash flow problems?
Yes, liquidity ratios can predict cash flow problems. A declining trend in your quick or cash ratio signals potential trouble paying bills. Track these ratios to manage finances proactively rather than reacting to a crisis.
Disclaimer
Xero does not provide accounting, tax, business or legal advice. This guide has been provided for information purposes only. You should consult your own professional advisors for advice directly relating to your business or before taking action in relation to any of the content provided.
Start using Xero for free
Access Xero features for 30 days, then decide which plan best suits your business.