Gross profit margin formula: calculate it step by step
Learn the gross profit margin formula, work through Singapore examples and compare your margin by industry.
Written by Lena Hanna—Trusted CPA Guidance on Accounting and Tax. Read Lena's full bio
Published Tuesday 6 October 2026
Table of contents
Key takeaways
- Calculate your gross profit margin by dividing gross profit by revenue and multiplying by 100. Count only direct costs in COGS, and use revenue net of goods and services tax (GST).
- Compare your margin against industry averages. NYU Stern’s January 2026 data for US-listed companies puts the all-market average at about 38% and general retail at about 33%.
- Improve your margins by negotiating better supplier rates and reducing waste, or by adjusting prices in line with competitors and your target margin.
- Track your gross profit margin monthly or quarterly to spot trends early, and reassess whenever your costs or sales shift.
What is gross profit margin?
Gross profit margin is the percentage of revenue remaining after you subtract the cost of goods sold (COGS). It shows how efficiently your business produces and sells products or services.
Understanding why gross profit margin matters helps you make better business decisions. Here’s what it reveals:

- measures production efficiency: shows how much you keep from each sale after direct costs
- identifies profitable areas: highlights which products or services generate the strongest returns
- shows pricing headroom: tells you how much room you have to offer discounts or absorb supplier price rises
- affects bottom-line health: low margins make it harder to cover operating expenses and reduce your chances of net profit
After paying operating expenses like rent and utilities, the remainder becomes your net profit.
Gross profit margin vs gross profit
Gross profit is a dollar amount: your revenue minus cost of goods sold.
Gross profit margin, often shortened to GP margin, is a percentage: your gross profit divided by revenue, multiplied by 100.
The term ‘gross margin’ means the same thing as gross profit margin, and you’ll also see it called the gross margin ratio. They’re used interchangeably.
Gross profit margin formula
The gross margin formula, also known as the gross profit margin formula, is:
Gross profit margin = (Gross profit ÷ Revenue) × 100
Here’s what each component means:
- gross profit: revenue minus cost of goods sold (COGS)
- revenue: total sales income
- COGS: the direct costs of producing what you sell
- result: expressed as a percentage
For example, if your gross profit is S$15,000 and revenue is S$50,000, your gross profit margin is 30%.
How to calculate gross profit margin
Calculating your gross profit margin involves a few simple steps. Here’s how to work through the process, followed by worked examples for different types of business.
Understanding cost of goods sold
Before you calculate your gross profit margin, you need to understand what goes into your COGS. COGS includes the direct costs of producing your products or delivering your services, such as raw materials, production labour and manufacturing overhead.
Make sure you estimate your COGS correctly, as it strongly affects the gross profit margin calculation.
Step by step calculation
Follow these steps to calculate your gross profit margin:
- find your revenue: add up your total sales for the period
- calculate COGS: total the direct costs of producing your goods or services
- subtract COGS from revenue: this gives you gross profit
- divide gross profit by revenue: this gives you a decimal
- multiply by 100: convert the decimal to a percentage
Gross profit margin example
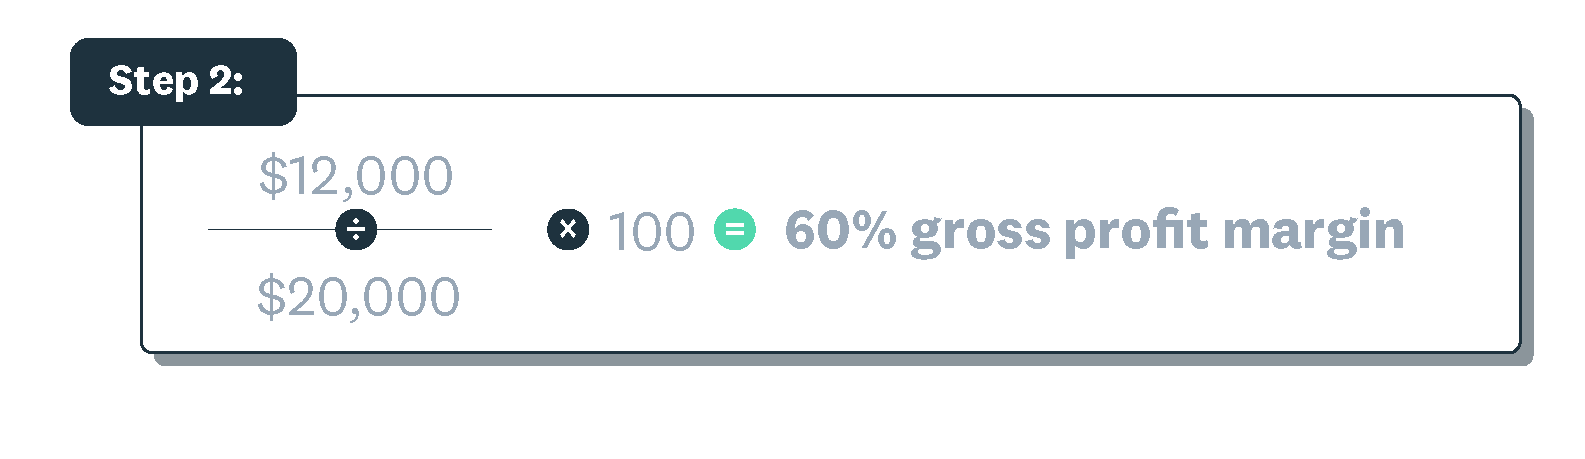
A service business is the simplest place to start. Here’s how a cleaning business would calculate gross profit margin:
- revenue: S$20,000 from cleaning services
- COGS: S$8,000 for supplies, equipment and direct labour
- gross profit: S$20,000 − S$8,000 = S$12,000
- gross profit margin: (S$12,000 ÷ S$20,000) × 100 = 60%
This means the business keeps S$0.60 of every S$1 earned after covering direct costs.

Calculating margin for a Singapore café
Café takings usually include goods and services tax (GST), so take it out before you start. GST is currently 9% in Singapore, and a GST-registered business collects it for the Inland Revenue Authority of Singapore (IRAS).
Here’s how a GST-registered café would work out its margin:
- takings including GST: S$43,600
- net sales: S$43,600 ÷ 1.09 = S$40,000
- COGS: S$22,000, made up of S$13,000 food and beverage stock plus S$9,000 direct kitchen labour
- gross profit: S$40,000 − S$22,000 = S$18,000
- gross profit margin: (S$18,000 ÷ S$40,000) × 100 = 45%
Using the GST-inclusive S$43,600 instead would push the margin up to about 49.5%. That’s a margin the café never earned, which is why net sales matter.
Comparing margins across product lines
Your overall margin can hide big differences between the things you sell. Here’s how an online retailer with two product lines would compare them:
- product A: S$10,000 revenue, S$7,000 COGS, S$3,000 gross profit, 30% margin
- product B: S$6,000 revenue, S$2,400 COGS, S$3,600 gross profit, 60% margin
- combined: S$16,000 revenue, S$9,400 COGS, S$6,600 gross profit, 41.25% margin
Product B earns more gross profit on less revenue. Shifting sales towards it lifts your overall margin, while a sales push on product A pulls the combined figure down.
Setting a price from a target margin
If you know your unit cost and the margin you want, you can work backwards to a price. Use this formula: Price = Cost ÷ (1 − target margin).
For a S$6 unit cost and a 60% target margin, the price is S$6 ÷ (1 − 0.60) = S$6 ÷ 0.40 = S$15.
Margin vs markup
Markup and margin use the same profit figure but divide it by different amounts, so they’re easy to mix up. Using the S$15 price above, the S$9 profit gives you:
- markup: (S$9 ÷ S$6 cost) × 100 = 150%
- margin: (S$9 ÷ S$15 price) × 100 = 60%
If you added a 60% markup to the S$6 cost instead, you’d charge S$9.60. That price gives you a margin of just 37.5%, well below your 60% target.
Avoid common calculation mistakes
Accurate COGS is essential for a reliable gross profit margin, and small categorisation errors can skew your results. Watch out for these mistakes:
- including operating expenses in COGS: rent, marketing and admin costs belong in operating expenses
- forgetting direct labour: wages for staff who produce goods or deliver services count as COGS
- omitting shipping costs: freight and delivery for materials typically belong in COGS
- using inconsistent time periods: match your revenue and COGS to the same reporting period
Your accountant can help you categorise costs correctly, or you can brush up on calculating cost of sales yourself.
What is a good gross profit margin?
A good gross profit margin depends on your industry. In NYU Stern’s January 2026 margin data, the average across all US-listed companies is about 38%. General retail sits at about 33%, grocery retail at about 26% and system and application software above 70%.
Your gross profit margin must be high enough to sustain your business operations. It needs to cover:
- operating expenses such as rent, utilities and salaries
- interest on any business loans
- taxes and other obligations
- money to reinvest in growth
The right target depends on your industry, business size, location and market conditions.
Factors affecting your margins
Several factors shape what’s realistic for your business. Here’s how each one plays out:
- industry: restaurants carry high direct food and labour costs, while software businesses have few direct costs for each sale
- region: local taxes, rent costs and customer traffic vary between locations
- business type: ecommerce stores often have lower overhead than physical retail, which leaves more room for competitive pricing
- market competition: competitive industries like electronics retail face price pressure that squeezes margins
Industry benchmarks for gross profit margin
Gross profit margins vary widely across industries. These are average gross margins for US-listed companies from NYU Stern’s Margins by Sector dataset (January 2026):
- software (system and application): 71.72%
- hotels and gaming: 60.85%
- apparel: 56.88%
- household products: 51.04%
- business and consumer services: 33.38%
- retail (general): 33.18%
- restaurants and dining: 32.24%
- retail (grocery and food): 26.31%
- auto and truck: 10.41%
- total market: 37.76%
Singapore small-business margins may differ from these US averages. Your accountant or bookkeeper can find specific benchmarks for small to medium businesses in your industry.
Benchmarking your gross profit margin
Compare your margin against similar businesses in your industry, region and size bracket for an accurate performance picture. Effective benchmarking requires comparing like with like:
- find industry data: check trade associations, accounting firms or government statistics
- match business size: compare against businesses with similar revenue
- consider location: regional cost differences affect what’s achievable
- ask your accountant: they can access benchmark data for your specific industry
When to reassess your gross profit margin
Regular margin reviews help you spot changes early. Alongside your usual monthly or quarterly check, review your margins when:
- costs change: supplier prices increase or new expenses arise
- sales shift: revenue grows or declines unexpectedly
- you miss targets: growth or profit goals aren’t met
- market conditions change: competitors adjust pricing or new players enter
Xero’s financial reports let you track margin changes in real time and spot trends as they develop.
Analysing gross profit margin for business insights
Gross profit margin analysis reveals which products, services or business areas generate the strongest returns. Use this insight to guide pricing and cost decisions:
- product-level profitability: which items earn the most after direct costs
- sales mix: how shifting sales between products changes your overall margin
- pricing opportunities: where you can adjust prices and keep your customers
- cost reduction targets: which expenses most affect your margins
Interpreting gross profit margin trends
Tracking your margin over time, alongside other key profitability ratios, shows whether your decisions are working. Here’s how to read the changes:
- rising margins: your pricing strategy or cost controls are working
- falling margins: costs may be increasing or prices may need adjustment
- seasonal fluctuations: some products or services perform better at certain times
- product variations: compare margins across offerings to identify top performers
Review trends monthly or quarterly to catch changes early.
Factors affecting gross profit margin
External forces can shift your margins even when your operations stay the same. Understanding these factors helps you respond quickly:
- demand changes: falling demand may force price reductions to attract customers
- supplier cost increases: rising material or labour costs narrow your margins
- customer spending power: economic conditions affect how much customers can pay
- competitor pricing: market pressure may limit how much you can charge
Gross profit margin compared with other metrics
Gross profit margin measures profitability after direct costs. Two related metrics, operating profit margin and net profit margin, provide deeper insight into your overall financial health.
Gross profit margin vs operating profit margin
The difference comes down to which costs you subtract:
- gross profit margin: revenue minus COGS only
- operating profit margin: revenue minus COGS and operating expenses such as rent, utilities and salaries
Operating profit margin shows whether your business covers all its day-to-day running costs as well as production costs.
Gross profit margin vs net profit margin
Net profit margin goes one step further and subtracts every cost:
- gross profit margin: revenue minus COGS
- net profit margin: revenue minus all costs, including COGS, operating expenses, interest and taxes
Net profit margin is your ‘bottom line’. It shows what percentage of revenue becomes actual profit after every expense. According to Brex, a 10% net profit margin is often treated as healthy and 20% as high, though this varies by industry.
How to use each metric
Each type of profit margin answers a different question about your business. Use them like this:
- gross profit margin: evaluate pricing decisions and production efficiency
- operating profit margin: assess whether revenue covers all operating costs
- net profit margin: guide long-term planning and measure overall financial resilience
Track all three to get a complete picture of your business’s profitability.
How to improve gross profit margin
Improving your gross profit margin frees up more money for operating costs and growth. Before you change anything, measure profitability across your business so you know where to focus.
Adjust your prices
A price rise with no change in costs goes straight to gross profit. When you’re ready to raise your prices, keep these points in mind:
- review regularly: check your prices whenever your costs change
- respond to competitors: keep track of what similar businesses charge
- add value first: improve your service or product before you ask customers to pay more
- test increases: try a small rise on one product and track the effect on sales
Reduce your cost of goods sold
You can lift your margin without touching prices by lowering what each sale costs you to deliver. Try these approaches:
- negotiate with suppliers: ask for bulk or early-payment discounts
- compare vendors regularly: check whether other suppliers offer better rates
- reduce waste: cut spoilage, breakage and rework in production
- review labour costs: match staff rosters to demand
Streamline your operations
Efficient processes cut the time and resources that go into each sale. Focus on these areas:
- automate repetitive tasks: use software to handle invoicing, inventory and reporting
- manage inventory tightly: order stock in line with your sales data
- review processes regularly: look for steps that add cost without adding value
- track time and resources: see where direct labour goes on each job
Accounting software like Xero automates financial tasks so you can focus on margin-improving decisions.
Use Xero to track your gross profit margin
Xero makes it easy to monitor your gross profit margin alongside other key metrics. With real-time financial reports, you can spot margin changes early and make informed pricing and cost decisions.
Spend less time on bookkeeping and more time growing your business when you get one month free.
FAQs on gross profit margin
Here are quick answers to common questions about gross profit margin.
What is the gross margin formula?
The gross margin formula is the same as the gross profit margin formula: (Revenue − COGS) ÷ Revenue × 100. Writing it this way lets you work straight from your sales and cost totals without calculating gross profit first.
What is GP margin?
GP margin is short for gross profit margin. You’ll often see it written as GP% on management reports, where it means exactly the same thing.
How do you calculate gross profit margin quickly?
Use the shortcut 1 − (COGS ÷ revenue), then multiply by 100. For example, S$60,000 of COGS on S$80,000 of revenue gives 1 − 0.75 = 0.25, or a 25% margin.
What does a 20% gross profit margin mean?
You keep S$0.20 of every S$1 in sales as gross profit, and the other S$0.80 covers the direct cost of producing your goods or services. Your operating expenses, such as rent and salaries, then come out of that S$0.20.
Should I include GST when calculating gross profit margin?
No, calculate your margin on sales net of GST, because the GST you charge customers is collected for IRAS. Record COGS without the GST you claim back, unless you’re not GST-registered and can’t claim it.
Can gross profit margin be negative?
Yes, it turns negative when COGS is higher than revenue: S$6,000 of direct costs on S$5,000 of sales gives −20%. It means each sale loses money before operating expenses, so review your pricing and supplier costs straight away.
Disclaimer
Xero does not provide accounting, tax, business or legal advice. This guide has been provided for information purposes only. You should consult your own professional advisors for advice directly relating to your business or before taking action in relation to any of the content provided.