Current ratio explained: meaning, formula, examples
Learn the current ratio formula, see a Hong Kong example and find out what a healthy ratio looks like.
Written by Jotika Teli—Certified Public Accountant with 24 years of experience. Read Jotika's full bio
Published Monday 26 October 2026
Table of contents
Key takeaways
- Work out your current ratio by dividing current assets by current liabilities, and check it monthly to spot liquidity trends early.
- A ratio between 1.5 and 3.0 is generally healthy. Below 1.0 can signal trouble paying short-term bills, while above 3.0 may mean assets are sitting idle.
- Compare your ratio with businesses in your industry, since service businesses often run on lower ratios than retailers or manufacturers that carry inventory.
- Use the current ratio alongside cash flow forecasts and profitability ratios, because it only shows your position at a single moment.
Current ratio definition
The current ratio is a liquidity ratio that compares your current assets with your current liabilities to show whether you can pay bills due in the next 12 months. Current ratio = current assets ÷ current liabilities.
It tells you whether your business can cover upcoming bills and loan repayments. You might also see it called the working capital ratio, and it’s one of several liquidity ratios for checking short-term financial health.
Unlike the quick ratio, the current ratio includes all current assets, even those that take longer to turn into cash, like inventory. This makes it a broader measure of short-term financial health.
Components of the current ratio
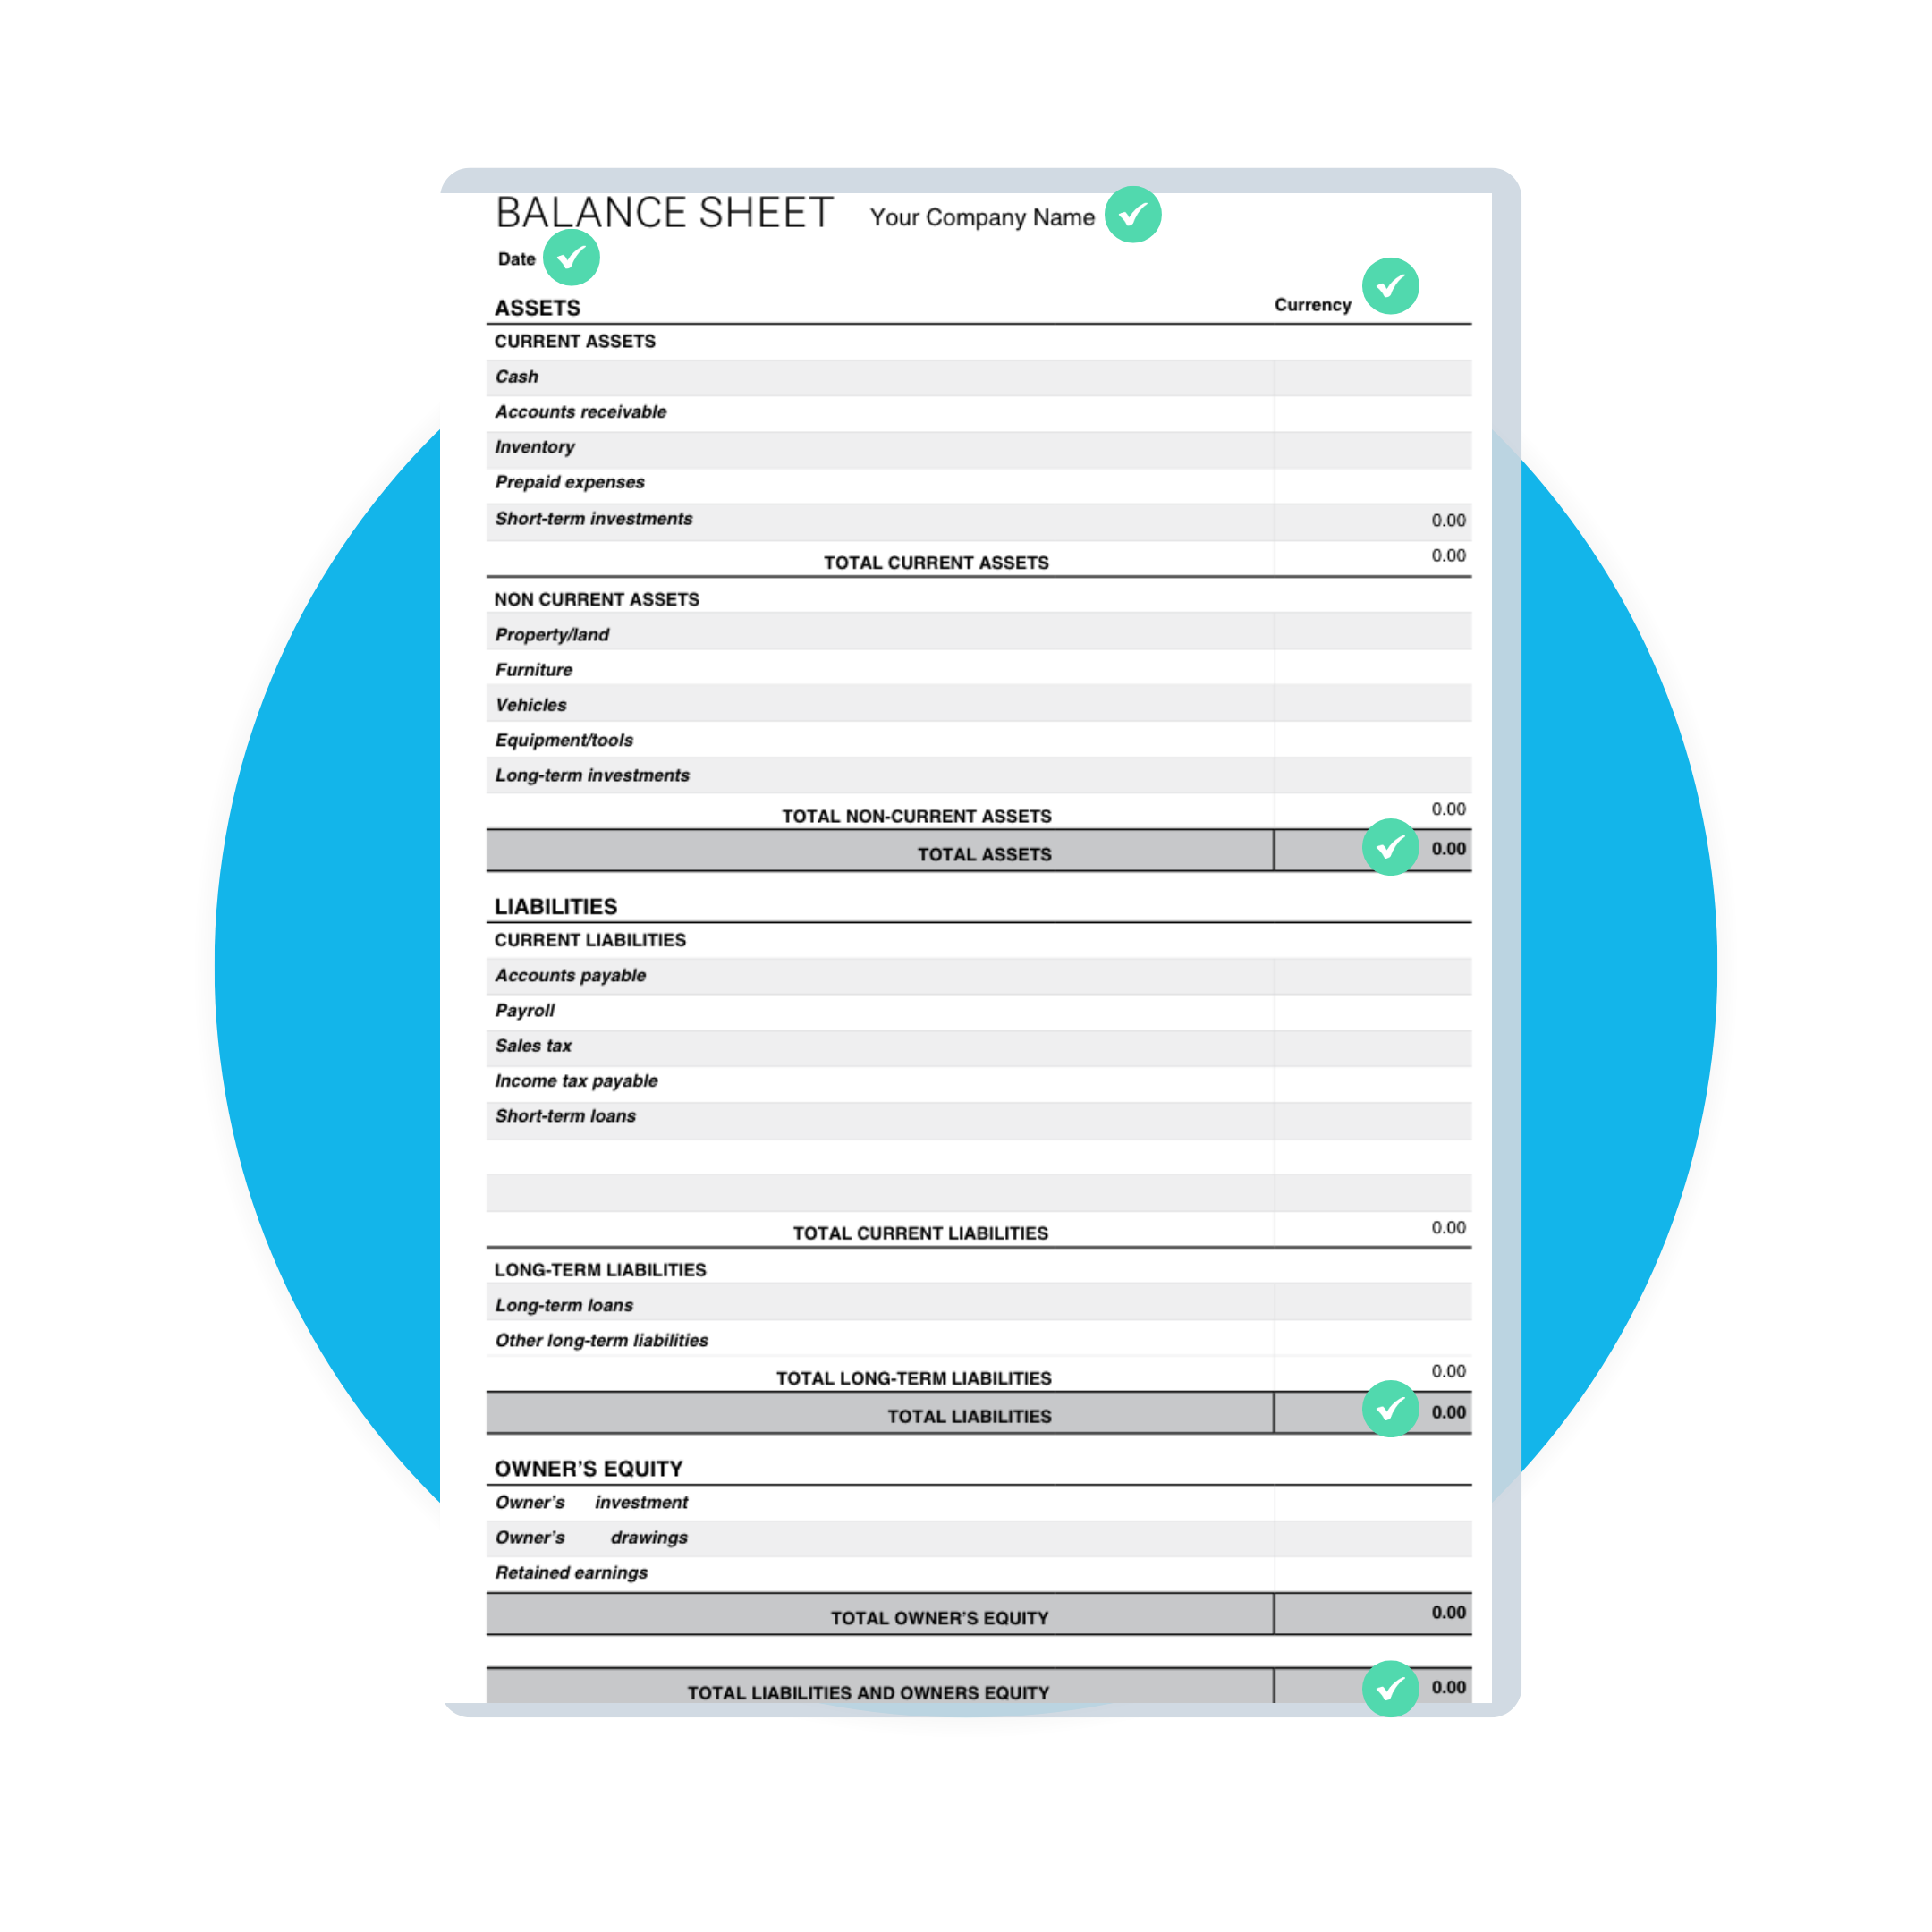
Before you calculate your current ratio, find two figures on your balance sheet: current assets and current liabilities.
Current assets are resources you expect to turn into cash within 12 months:
- Cash and cash equivalents: money in bank accounts and short-term deposits
- Inventory (inventories): goods available for sale
- Short-term investments: securities you can liquidate quickly
- Prepaid expenses (prepayments): payments made in advance for future goods or services
Current liabilities are obligations due within 12 months:
Current ratio formula

Current ratio liquidity formula.
Both figures you need are on your balance sheet, which keeps the calculation simple. Divide your total current assets by your total current liabilities to get your current ratio.
Example of a current ratio calculation
Say you run a small trading company in Kwun Tong that imports kitchenware and sells it to local retailers. You want to check whether you can cover your supplier bills and the next 12 months of bank loan repayments.
Your balance sheet shows these current assets:
- Cash and cash equivalents: HK$420,000
- Trade receivables: HK$610,000
- Inventories: HK$530,000
- Prepayments: HK$40,000
Your current liabilities are:
- Trade payables: HK$480,000
- Bank overdraft: HK$120,000
- Accruals: HK$90,000
- Current portion of bank loan: HK$310,000
Your total current assets are HK$1,600,000 and your total current liabilities are HK$1,000,000. HK$1,600,000 ÷ HK$1,000,000 = 1.6, so you have HK$1.60 in current assets for every HK$1 you owe in the next 12 months. That leaves a HK$600,000 buffer you could put towards growth or hold as a safety net.
These line items follow IAS 1 (paragraphs 54 and 66–71), which HKAS 1 mirrors in Hong Kong. HKFRS has been converged with IFRS since 2005, according to the IFRS Foundation’s Hong Kong jurisdiction profile. That’s why HKFRS balance sheets use these terms, although some small private companies report under the simpler SME framework instead.
What is a good current ratio?
Once you’ve calculated your current ratio, you’ll want to know whether the result signals financial health or risk. Use these ranges as a starting point:
- Below 1.0: your current liabilities are higher than your current assets, which may make short-term bills hard to pay
- 1.0 to 1.5: you can cover your debts, with a limited buffer
- 1.5 to 3.0: your liquidity is generally healthy
- Above 3.0: your liquidity is strong, though some assets may be sitting idle
The low end of this scale deserves the most attention. A study published in Accounting & Finance found failure risk is higher when current ratios are low, with little link at higher levels.
Across about 3,460 US-listed companies, the all-industry median in the ReadyRatios dataset was 1.78 in 2025. The right ratio for you still depends on your industry, business model and growth stage.
ReadyRatios’ 2025 figures for US-listed companies show how much sectors differ:
- Retail: food stores 1.28, general merchandise stores 1.16, apparel stores 1.48
- Wholesale trade: durable goods 2.03, non-durable goods 1.56
- Services: business services 1.50, personal services 0.75
- Food and drink: eating and drinking places 0.83
Service businesses with minimal inventory often operate well with lower ratios, and some sectors sit below 1.0 in this data. Retail or manufacturing businesses typically need higher ratios to account for slower-moving inventory. These are US figures, so use them as a guide and compare yourself with similar businesses.
If you’re planning to borrow in Hong Kong, what a lender asks for depends on the product. HSBC’s Business Instalment Loan, an unsecured SME loan, doesn’t need financial statements. Its version under the SME Financing Guarantee Scheme (SFGS) needs at least one year of operation in Hong Kong and a good repayment record.
According to the Hong Kong Monetary Authority (HKMA), the SFGS 80% guarantee product takes applications until 31 March 2028. The 90% product closed on 31 March 2026. For a larger application, a healthy current ratio is useful evidence that your business can meet its short-term commitments.
How to interpret your current ratio
A single result tells you where you stand today. Track your current ratio over time to spot trends and make informed decisions:
- Calculate it at the same point each month so you compare like with like.
- Compare each result with previous months to see which way your liquidity is moving.
- Consider the context: growing businesses can see temporary dips below 1.0 while they invest in expansion, so focus on whether low ratios persist.
- Combine it with profitability ratios and cash flow forecasts for a fuller picture.
Current ratio vs quick ratio and other liquidity ratios
The current ratio gives you a broad view of liquidity, while other ratios offer stricter perspectives. Here’s the one-line formula for each:
- Current ratio = current assets ÷ current liabilities
- Quick ratio = (current assets − inventories − prepayments) ÷ current liabilities
- Cash ratio = (cash + cash equivalents) ÷ current liabilities
The quick ratio, also called the acid test ratio, leaves out inventory and only counts assets you can turn into cash quickly, so it’s more conservative. The cash ratio is the most stringent, comparing only cash and cash equivalents with your current liabilities. You can see the two most common measures side by side in this quick vs current ratio comparison.
Each of these ratios looks at the next 12 months. For long-term health, check your gearing ratio, which compares debt with equity, and your solvency, which is your ability to meet long-term obligations.
What are the limitations of using the current ratio?
The current ratio is quick to work out, and it helps to know where it can mislead you:
- Snapshot timing: it captures a single moment
- Asset quality: it counts all current assets equally, so slow-moving inventory may overstate liquidity
- Seasonal swings: peak-season ratios can look very different from slow periods
- Liability timing: it assumes all liabilities fall due at once
Current ratio in relation to working capital and cash flow
The current ratio works best alongside related measures that show your liquidity in dollar terms and over time:
- Cash flow: the ongoing movement of money in and out of your business
- Free cash flow: operating cash flow minus capital expenditure
Track your current ratio in real time with Xero
Working out your current ratio by hand takes time, and the numbers change every day. Xero keeps your balance sheet up to date in real time, so you can:
- see your cash position at a glance on dashboards
- track liquidity trends month to month
- connect bank feeds that update automatically
- create cash flow forecasts and projections
Keep your liquidity in view all year when you try Xero and get one month free.
FAQs on current ratio
Here are quick answers to common questions about the current ratio.
Is 1.0 a good current ratio?
A current ratio of 1.0 means your current assets exactly cover your current liabilities, leaving no buffer for unexpected costs or slow payers. Aiming for 1.5 or above gives you more room to handle surprises.
What does a current ratio of 2.5 mean?
You have HK$2.50 in current assets for every HK$1 of current liabilities, which shows strong liquidity. If your ratio stays above 3.0, consider putting some of those assets to better use.
Can a current ratio be too high?
Yes, a very high ratio may mean surplus cash or stock is sitting idle instead of funding growth. CFI notes there’s no universal upper limit, because the right level depends on your industry.
How can I improve my current ratio?
Increase your current assets or reduce your current liabilities. Collecting invoices sooner, clearing excess stock, paying down short-term debt and negotiating longer supplier terms can all help.
Does my industry affect what’s considered a good current ratio?
Yes, and the gap between sectors can be wide. Eqvista’s March 2025 figures put investment trusts and mutual funds at 29.95 and discount stores at 1.11.
How often should I calculate my current ratio?
Check it at least monthly, at the same point each month. With Xero, you can keep an eye on it in real time as your balance sheet updates.
Disclaimer
Xero does not provide accounting, tax, business or legal advice. This guide has been provided for information purposes only. You should consult your own professional advisors for advice directly relating to your business or before taking action in relation to any of the content provided.
Start using Xero for free
Access Xero features for 30 days, then decide which plan best suits your business.