Current ratio explained: meaning, formula, examples
Discover how the current ratio helps you manage liquidity, avoid cash crunches, and make smarter decisions.
Written by Jotika Teli—Certified Public Accountant with 24 years of experience. Read Jotika's full bio
Published Monday 23 February 2026
Table of contents
Key takeaways
- Calculate your current ratio monthly by dividing current assets by current liabilities to track your business's ability to pay short-term debts and spot liquidity trends early.
- Aim for a current ratio between 1.5 and 3.0 for most businesses, as ratios below 1.0 signal potential payment difficulties while ratios above 3.0 may indicate idle assets that could fuel growth.
- Compare your current ratio to industry benchmarks rather than universal standards, since service businesses often operate successfully with lower ratios than retail or manufacturing companies that carry inventory.
- Use current ratio alongside other financial metrics like cash flow forecasts and profitability ratios to get a complete picture of your business health, as current ratio alone provides only a snapshot of one moment in time.
Current ratio definition
Current ratio is a liquidity ratio that measures your business's ability to pay upcoming bills and make loan repayments. You might also see it called the working capital ratio. Learn more about liquidity ratios and the working capital ratio.
Unlike the quick ratio, current ratio includes all current assets, even those that take longer to convert to cash, like inventory. This makes it a broader measure of short-term financial health.
Components of the current ratio
Before calculating your current ratio, identify two key figures from your balance sheet: current assets and current liabilities.
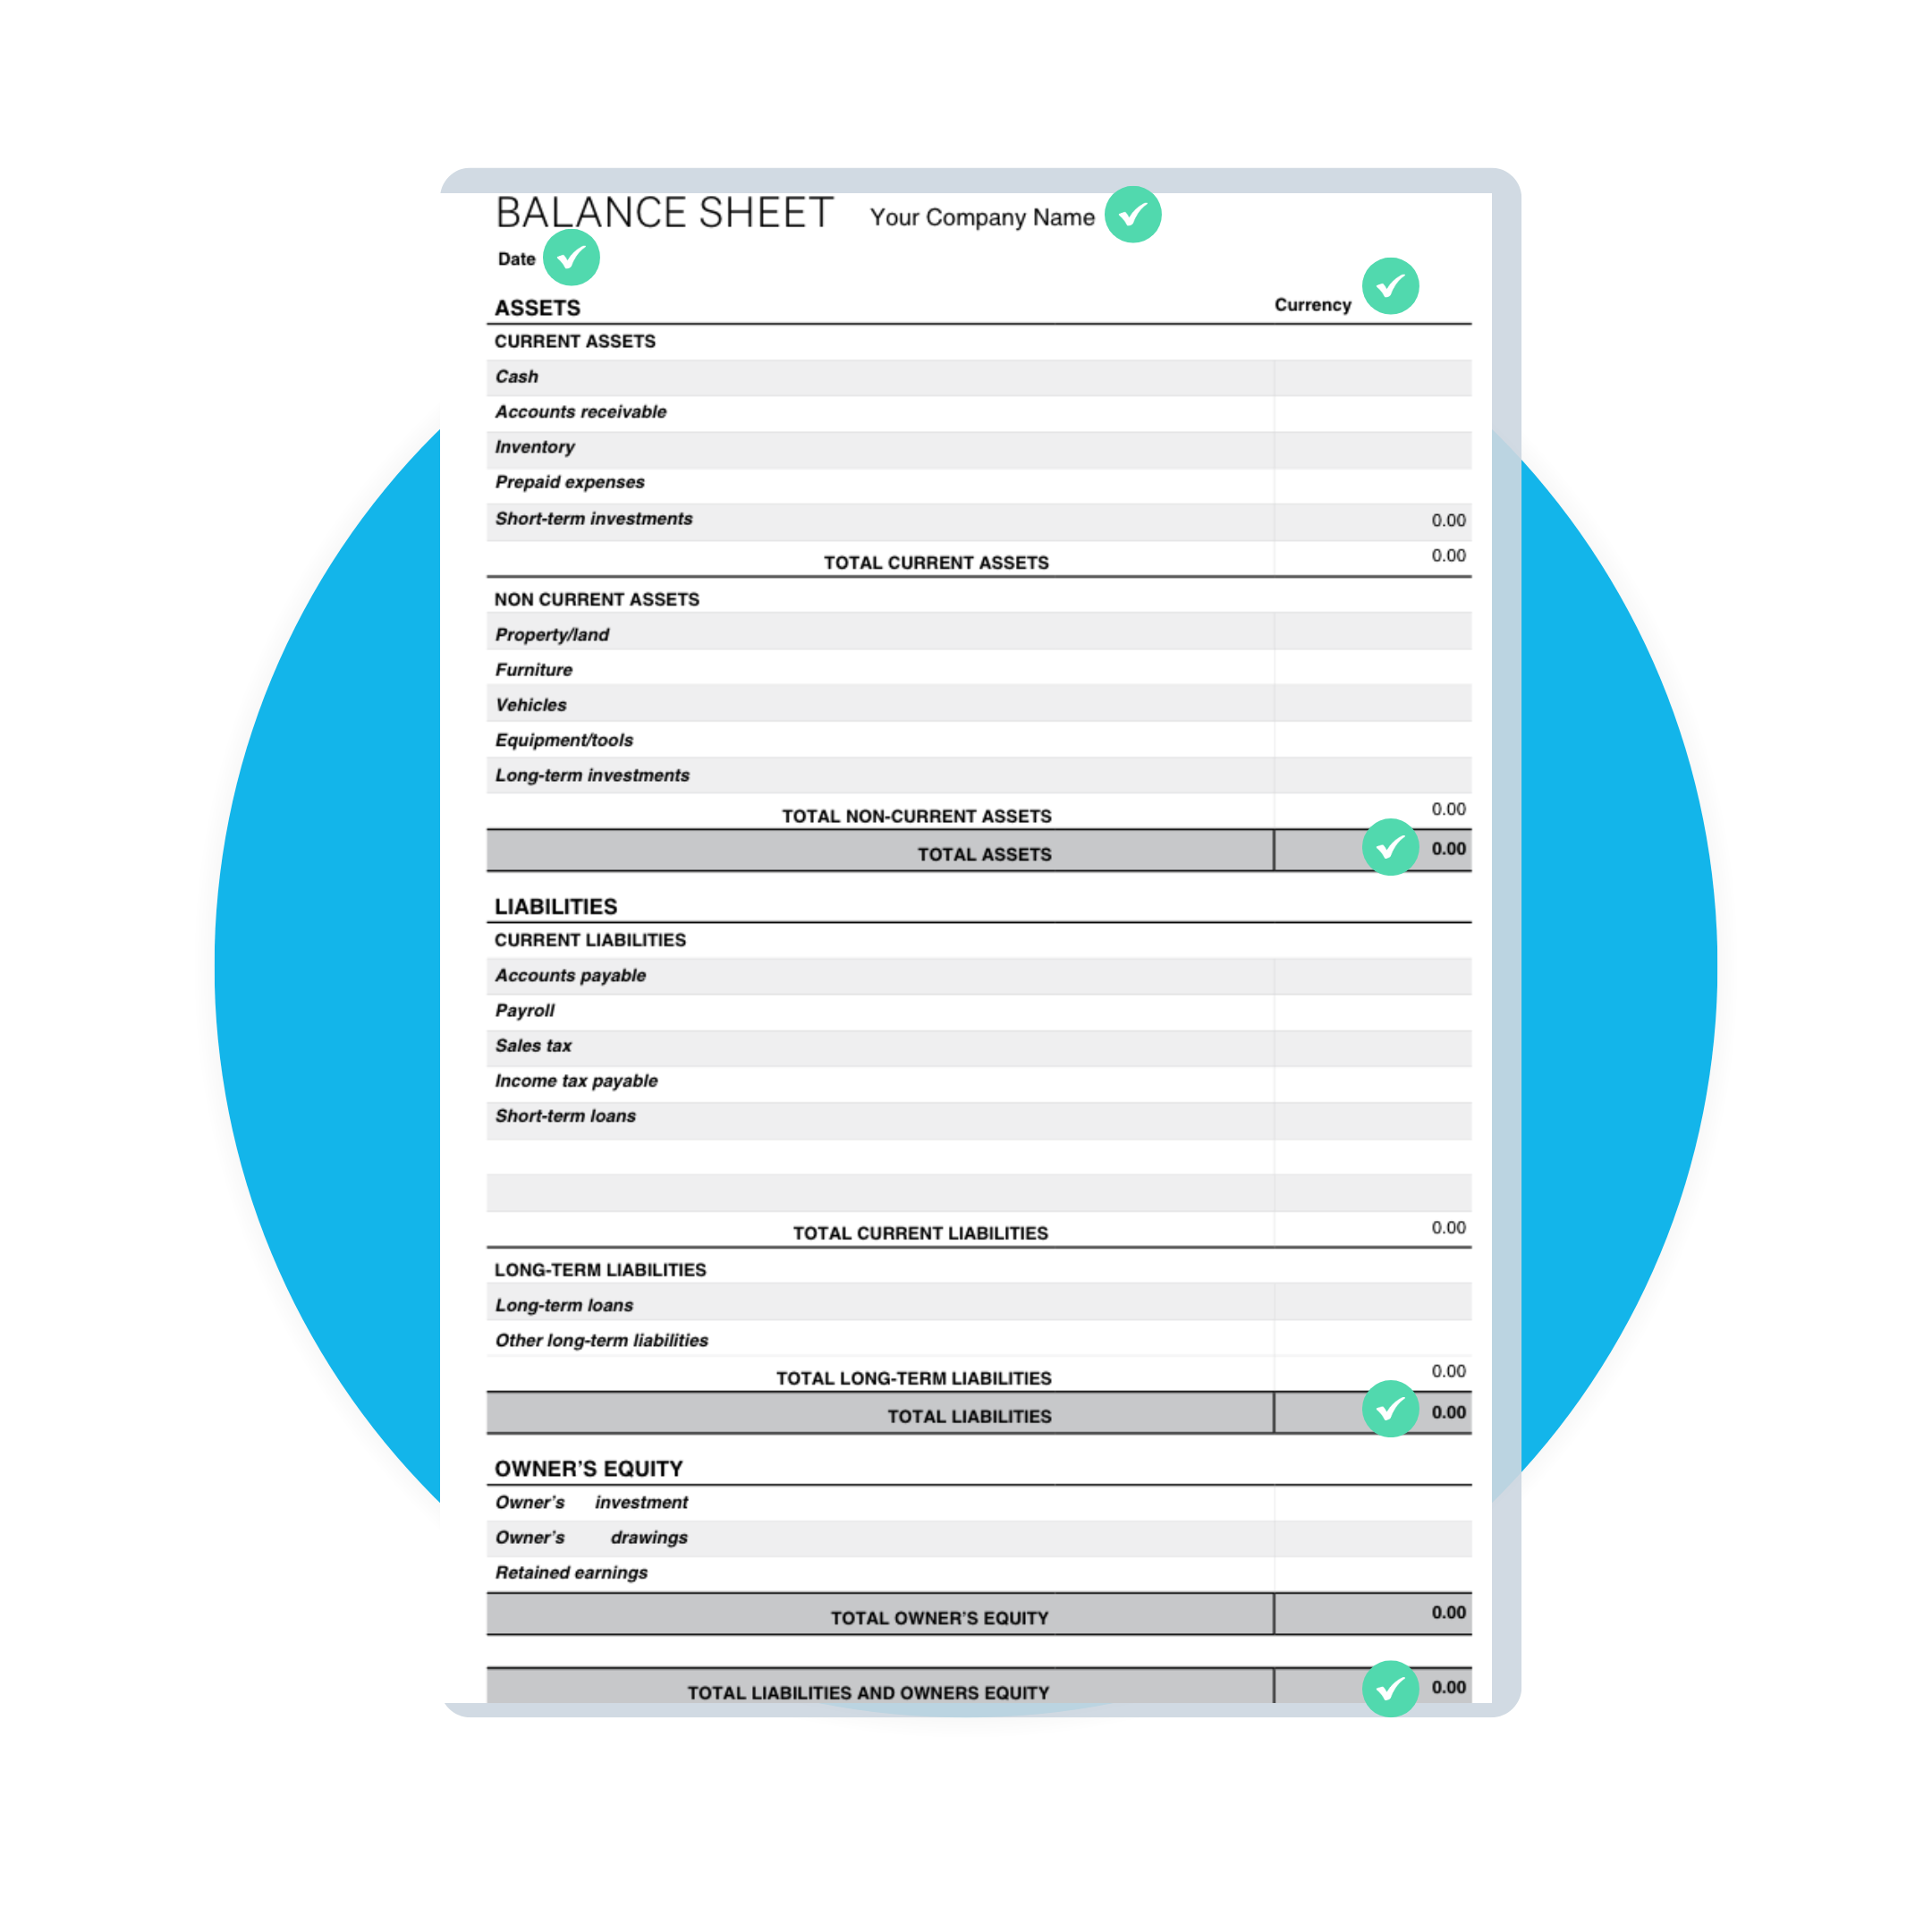
Current assets are resources you expect to convert to cash within 12 months:
- Cash and cash equivalents: money in bank accounts and short-term deposits
- Accounts receivable: payments owed to you by customers
- Inventory: goods available for sale
- Short-term investments: securities you can liquidate quickly
- Prepaid expenses: payments made in advance for future services
Current liabilities are obligations due within 12 months:
- Accounts payable: bills you owe to suppliers
- Short-term loans: credit lines and loans due within a year
- Accrued expenses: wages, taxes, and other costs you've incurred but not yet paid
- Current portion of long-term debt: loan payments due in the next 12 months
Current ratio formula
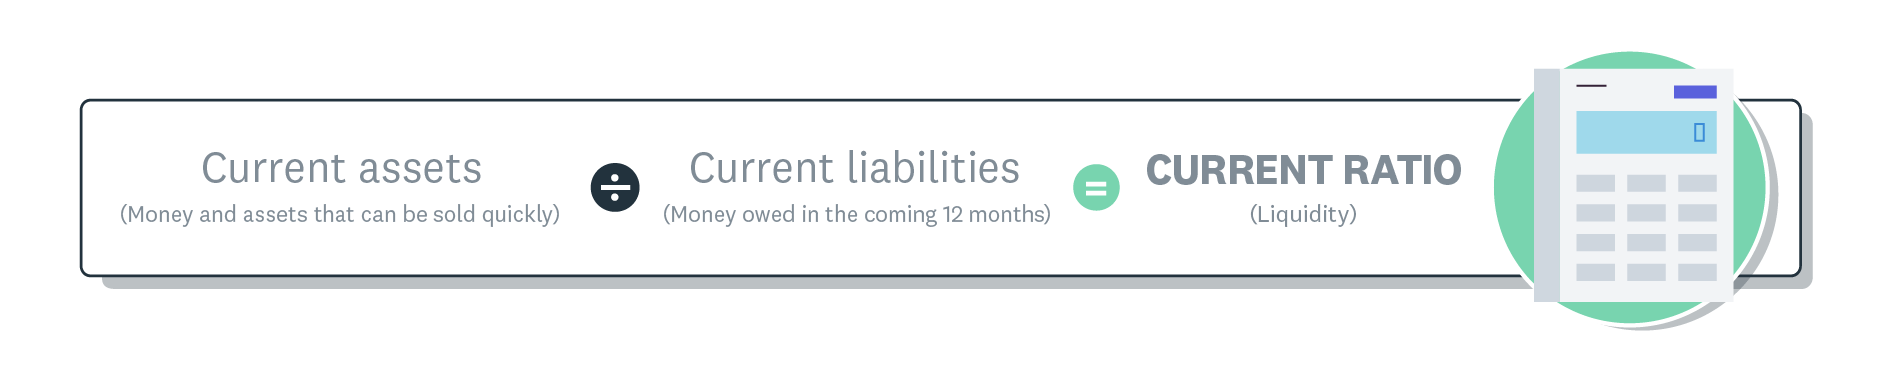
Current ratio liquidity formula.
Both figures you need are on your balance sheet, which makes the calculation straightforward. Divide your total current assets by your total current liabilities to get your current ratio.
Example of a current ratio calculation
A small construction business wants to work out its current ratio to see if it can cover upcoming loan repayments and material costs.
The business has $250,000 in current assets and $175,000 in current liabilities. The current ratio calculation is:
$250,000 / $175,000 = 1.43
What this means: The ratio is above 1.0, so the company can cover its upcoming liabilities. For every $1 of liabilities, the business has $1.43 available.
With this buffer, the company could invest in growth opportunities. Alternatively, it could hold onto the extra cash as a safety net for periods when assets dip or liabilities rise.
What is a good current ratio?
After calculating your current ratio, you need to know whether your result signals financial health or risk. Here's what different ratio ranges typically indicate:
- Below 1.0: Your current liabilities exceed current assets, which may signal difficulty paying short-term obligations and increase long-term risk. Research has shown that businesses with a low ratio of 0.35 face a predicted 5-year failure rate of 20.8%, compared to just 8.7% for businesses with a healthier ratio of 2.17.
- 1.0 to 1.5: You can cover your debts, but there's limited buffer for unexpected expenses
- 1.5 to 3.0: Generally considered healthy for most businesses, with comfortable liquidity. For context, data from over 3,500 U.S. companies shows the average current ratio across all industries was 1.72 in 2024.
- Above 3.0: Strong liquidity, but you may have idle assets that could be invested in growth
The ideal current ratio varies by industry, business model, and growth stage. For example, the Eating and drinking places industry operated with an average current ratio of just 0.76 in 2024, demonstrating that some sectors can function with ratios below 1.0.
Service businesses with minimal inventory often operate well with lower ratios. Retail or manufacturing businesses typically need higher ratios to account for slower-moving inventory.
How to interpret your current ratio
Your current ratio tells you more than just a single number. Track it over time to spot trends and make informed decisions.
- Measure consistently: Calculate your ratio at the same point each month to compare like for like. This reveals whether your liquidity is improving, declining, or stable.
- Consider context: A ratio below 1.0 isn't always cause for alarm. Growing businesses often see temporary dips when investing in expansion. What matters is whether low ratios persist.
- Use multiple metrics: Current ratio is one view of your finances. Combine it with profitability ratios and cash flow forecasts for a complete picture of your business health.
Current ratio vs quick ratio and other liquidity ratios
Current ratio gives you a broad view of liquidity, but other ratios offer different perspectives. Here's how current ratio compares to other liquidity ratios:
- Quick ratio (acid test ratio): Excludes inventory and only includes assets convertible to cash within 90 days. This gives a more conservative view of your ability to pay immediate obligations.
- Cash ratio: Compares only cash and cash equivalents to current liabilities, making it the most stringent measure. This shows whether you could pay all debts using cash on hand.
Each ratio answers a different question about your liquidity. Using them together shows how much cash you have available at different times and for different purposes. Learn more in our guide to liquidity ratios.
What are the limitations of using the current ratio?
Like all liquidity ratios, current ratio has limitations to keep in mind:
- Snapshot timing: Captures a single moment rather than reflecting how cash flow changes daily or how payment timing affects your actual cash position.
- Asset quality ignored: Counts all current assets equally, but cash is immediately available while inventory may take months to sell. A high ratio driven by slow-moving inventory may overstate your true liquidity.
- Seasonal distortion: Affects businesses with seasonal revenue, which may see ratios that don't reflect their overall financial health. A ratio calculated during peak season looks very different from one during a slow period.
- Liability timing assumed: Assumes all liabilities come due at once, which rarely happens in practice.
Current ratio in relation to working capital and cash flow
Current ratio measures spending power, but it's closely related to other financial metrics. Here's how they connect:
- Working capital: Shows the dollar amount left after subtracting current liabilities from current assets. While current ratio expresses this as a ratio, working capital shows the actual figure.
- Cash flow: Tracks the net movement of money in and out of your bank account. Current ratio is a snapshot; cash flow shows the ongoing movement.
- Free cash flow: Represents what remains after subtracting capital expenditure from operating cash flow. This indicates how much cash is available for growth after essential investments.
Track your current ratio in real-time with Xero
Calculating current ratio manually takes time, and the numbers change as your assets and liabilities shift daily. Xero simplifies this by keeping your balance sheet updated in real time.
With Xero, you can:
- See your cash position at a glance: Real-time dashboards show current assets and liabilities as transactions flow through
- Track liquidity trends over time: Monitor how your current ratio changes month to month
- Connect bank feeds automatically: Keep current asset figures accurate without manual data entry
- Create forecasts and projections: Use reporting features to plan ahead and make confident financial decisions
Get one month of Xero for free.
FAQs on current ratio
Here are answers to common questions about current ratio that small business owners ask.
What is a good current ratio?
A good current ratio typically falls between 1.5 and 3.0 for most businesses. This range indicates you can comfortably cover short-term obligations while maintaining a buffer for unexpected expenses. The ideal ratio varies by industry, with service businesses often operating well at lower ratios than retail or manufacturing.
Is 1.0 a good current ratio?
A current ratio of 1.0 means you have exactly enough current assets to cover current liabilities. While this meets the minimum threshold, it leaves no buffer for unexpected expenses or delays in collecting receivables. Most lenders and financial advisors recommend maintaining a ratio above 1.5.
What does a current ratio of 2.5 mean?
A current ratio of 2.5 means you have $2.50 in current assets for every $1.00 of current liabilities. This indicates strong liquidity and suggests your business can comfortably meet short-term obligations. If your ratio consistently exceeds 3.0, consider whether those assets could be put to better use for growth.
How can I improve my current ratio?
Improve your current ratio by increasing current assets or decreasing current liabilities. Collect outstanding invoices faster, reduce excess inventory, or negotiate longer payment terms with suppliers. Focus on sustainable improvements that align with your business strategy rather than short-term fixes that harm cash flow.
Does my industry affect what's considered a good current ratio?
Yes, industry norms vary significantly. For example, some financial sectors have exceptionally high liquidity; the Investment trusts/mutual funds industry has an average ratio of 29.95, while the average for discount stores is closer to 1.11. Service businesses with minimal inventory often operate successfully with ratios between 1.0 and 1.5. Retail or manufacturing businesses typically need ratios between 1.5 and 2.5 to account for inventory cycles. Compare your ratio to industry benchmarks for the most meaningful assessment.
How often should I calculate my current ratio?
Calculate your current ratio at least monthly to track trends and spot potential liquidity issues early. Measure at the same point each month for consistent comparison. With accounting software like Xero, you can view your ratio in real time as your balance sheet updates automatically.
Disclaimer
Xero does not provide accounting, tax, business or legal advice. This guide has been provided for information purposes only. You should consult your own professional advisors for advice directly relating to your business or before taking action in relation to any of the content provided.
Start using Xero for free
Access Xero features for 30 days, then decide which plan best suits your business.