What a KPI means in business: key types and examples
Learn what KPI means in business and use simple metrics to track your goals, spot issues, and grow profit.
Written by Jotika Teli—Certified Public Accountant with 24 years of experience. Read Jotika's full bio
Published Saturday 21 March 2026
Table of contents
Key takeaways
- Choose 5-8 KPIs that directly connect to your specific business goals and industry, mixing financial metrics like gross profit margin with operational ones like customer retention rate to get a complete performance picture.
- Track both leading indicators that predict future performance (like sales pipeline and website enquiries) and lagging indicators that measure past results (like quarterly revenue) to balance forward-looking insights with historical data.
- Review your KPIs consistently with proper context by comparing current numbers to historical data, industry benchmarks, and seasonal patterns rather than reacting to single data points without understanding what's driving the changes.
- Focus on KPIs that are measurable, actionable, and directly influence your business decisions rather than tracking every available metric, since too many indicators dilute your focus and make it harder to spot what truly matters.
What does KPI mean in business?
A key performance indicator (KPI) is a measurable value that shows how effectively your business is achieving its goals. KPIs turn raw data into clear signals about what's working and what needs attention.
Think of KPIs like health metrics. Your blood pressure, cholesterol level, and body mass index (BMI) each tell part of the story. Together, they give your doctor a complete picture of your health.
Business KPIs work the same way. Debtor days, gross profit percentage, and debt/equity ratio each measure something specific. Combined, they show how your business is really performing.
Every business tracks different KPIs based on their goals and industry. But the purpose is always the same: to measure what matters most so you can make informed decisions.
Why KPIs matter for your business
KPIs matter because they replace guesswork with data. Without clear metrics, you're making decisions based on gut feeling alone. With the right KPIs, you can spot problems early, track progress toward goals, and focus your time on what actually drives results.
KPIs help your business in four key ways:
- make confident decisions: base choices on real numbers rather than assumptions
- catch problems early: spot warning signs before they become crises
- track progress: see whether you're moving toward your goals
- focus your efforts: know which activities actually improve performance
For small business owners juggling multiple responsibilities, KPIs cut through the noise. They tell you where to spend your limited time for the biggest impact.
Types of KPIs
KPIs fall into several categories depending on what you're measuring and why. Understanding these types helps you choose a balanced set of indicators for your business.
The first way to categorize KPIs is by what they measure.
Financial vs. non-financial KPIs
- Financial KPIs measure money: revenue, profit margins, cash flow, and expenses
- Non-financial KPIs measure everything else: customer satisfaction, employee retention, website traffic, and production efficiency
Another important distinction is timing.
Leading vs. lagging indicators
- Leading indicators predict future performance: sales pipeline, website enquiries, customer complaints
- Lagging indicators measure past results: quarterly revenue, annual profit, customer churn rate
You can also categorize KPIs by their scope and timeframe.
Strategic vs. operational KPIs
- Strategic KPIs track long-term goals: market share, year-over-year growth, brand awareness
- Operational KPIs track daily activities: orders processed, response times, inventory turnover
Most small businesses benefit from a mix of all types. Financial KPIs show the bottom line, while non-financial KPIs reveal what's driving those results.
Four KPI categories to improve your business
These four categories help you organize your KPIs around specific business outcomes. Choose KPIs from each area to get a complete picture of performance.
1. Efficiency
Efficiency KPIs show how well you use your resources.
- Reduce waste: track resource usage to cut unnecessary costs
- Improve productivity: measure output per employee or per hour
- Lower inventory days: minimize storage costs by moving stock faster
2. Growth
Growth KPIs track how your business expands over time.
- Increase revenue: track gross and net sales over time
- Build equity: measure how your business wealth grows year over year
3. Health
Health KPIs reveal your business's financial stability.
- Balance debt and equity: maintain sustainable borrowing levels
- Optimize working capital: align inventory with what you owe suppliers
- Speed up receipts: shorten the time between invoicing and payment
4. Resilience
Resilience KPIs measure your ability to weather challenges.
- Reduce credit risk: keep debt at manageable levels
- Strengthen interest coverage: ensure profits cover your borrowing costs
- Increase equity-to-assets: build a stronger financial foundation
Your accountant can help you identify additional KPIs specific to your industry and goals. Cloud-based accounting software analytics makes tracking these metrics simple, with dashboards you can check from anywhere.
Common KPI examples for small businesses
The best KPIs for your business depend on your goals and industry. Here are common examples that work well for most small businesses.
Financial KPIs
These measure your monetary performance.
- Gross profit margin: revenue minus cost of goods sold, divided by revenue. Shows how much you keep from each sale.
- Net profit margin: total profit after all expenses, divided by revenue. Shows your true bottom line.
- Debtor days: average time customers take to pay invoices. Lower is better for cash flow.
- Current ratio: current assets divided by current liabilities. Shows whether you can cover short-term debts.
Operational KPIs
These track your day-to-day business activities.
- Inventory turnover: how many times you sell and replace stock per year. Higher turnover means less money tied up in inventory.
- Customer acquisition cost: total marketing spend divided by new customers gained. Shows whether your marketing delivers value.
- Customer retention rate: percentage of customers who return. Repeat customers cost less to serve than new ones.
Cash flow KPIs
These monitor how money moves through your business.
- Operating cash flow: cash generated from normal business activities. Shows whether your core business generates money.
- Cash conversion cycle: days between paying suppliers and receiving customer payments. Shorter cycles mean healthier cash flow.
Your accountant can help you identify which KPIs matter most for your specific situation.
What makes a good KPI?
Not every metric qualifies as a KPI. A good KPI is measurable, meaningful, and actionable. The best ones share these characteristics:
- relevant: directly connected to your business goals and priorities
- measurable: based on data you can actually track and quantify
- understandable: clear enough that everyone in your business knows what it means
- actionable: gives you information you can act on to improve performance
- timely: updated frequently enough to guide decisions
A common mistake is tracking too many metrics without focus. If a number doesn't help you make better decisions, it's not a true KPI.
Financial KPIs come from your accounting system. Non-financial KPIs come from other sources like your website analytics, customer relationship management (CRM) software, or customer surveys. A balanced approach includes both.
How to choose the right KPIs for your business
Choose KPIs that connect directly to your business goals. The right metrics for a retail shop differ from those for a consulting firm. Focus on indicators that will actually change how you make decisions.
When selecting KPIs, consider:
- your industry: retail businesses track inventory turnover; service businesses track billable hours
- your business stage: startups focus on growth metrics; established businesses focus on profitability
- your goals: growth-focused businesses track revenue; efficiency-focused businesses track margins
- your capacity: only measure what you can realistically track and act on
How many KPIs should you track?
Small businesses typically need five to eight KPIs. Larger organizations might track that many per department. More isn't better. Too many metrics dilute your focus and make it harder to spot what matters.
Your accountant can help you identify the KPIs that fit your specific situation. They'll consider your industry benchmarks, business size, and personal goals to recommend the right mix.
How to track and understand your KPIs
Numbers without context can mislead. Before reacting to any metric, consider what might be driving the change.
Context matters for accurate interpretation:
- seasonal patterns: a sales dip in summer might be normal for winter clothing. Compare to the same period last year, not last month.
- strategic decisions: inventory turnover might drop because you stocked up during a supplier sale. That's a smart move, not a problem.
- external factors: economic conditions, competitor actions, or supply chain issues can all affect your numbers.
How to track KPIs effectively:
- Set a regular review schedule: weekly for operational KPIs, monthly for financial KPIs.
- Compare to benchmarks: your own historical data, industry averages, or targets you've set.
- Look for trends: single data points matter less than patterns over time.
- Ask why: investigate significant changes before taking action.
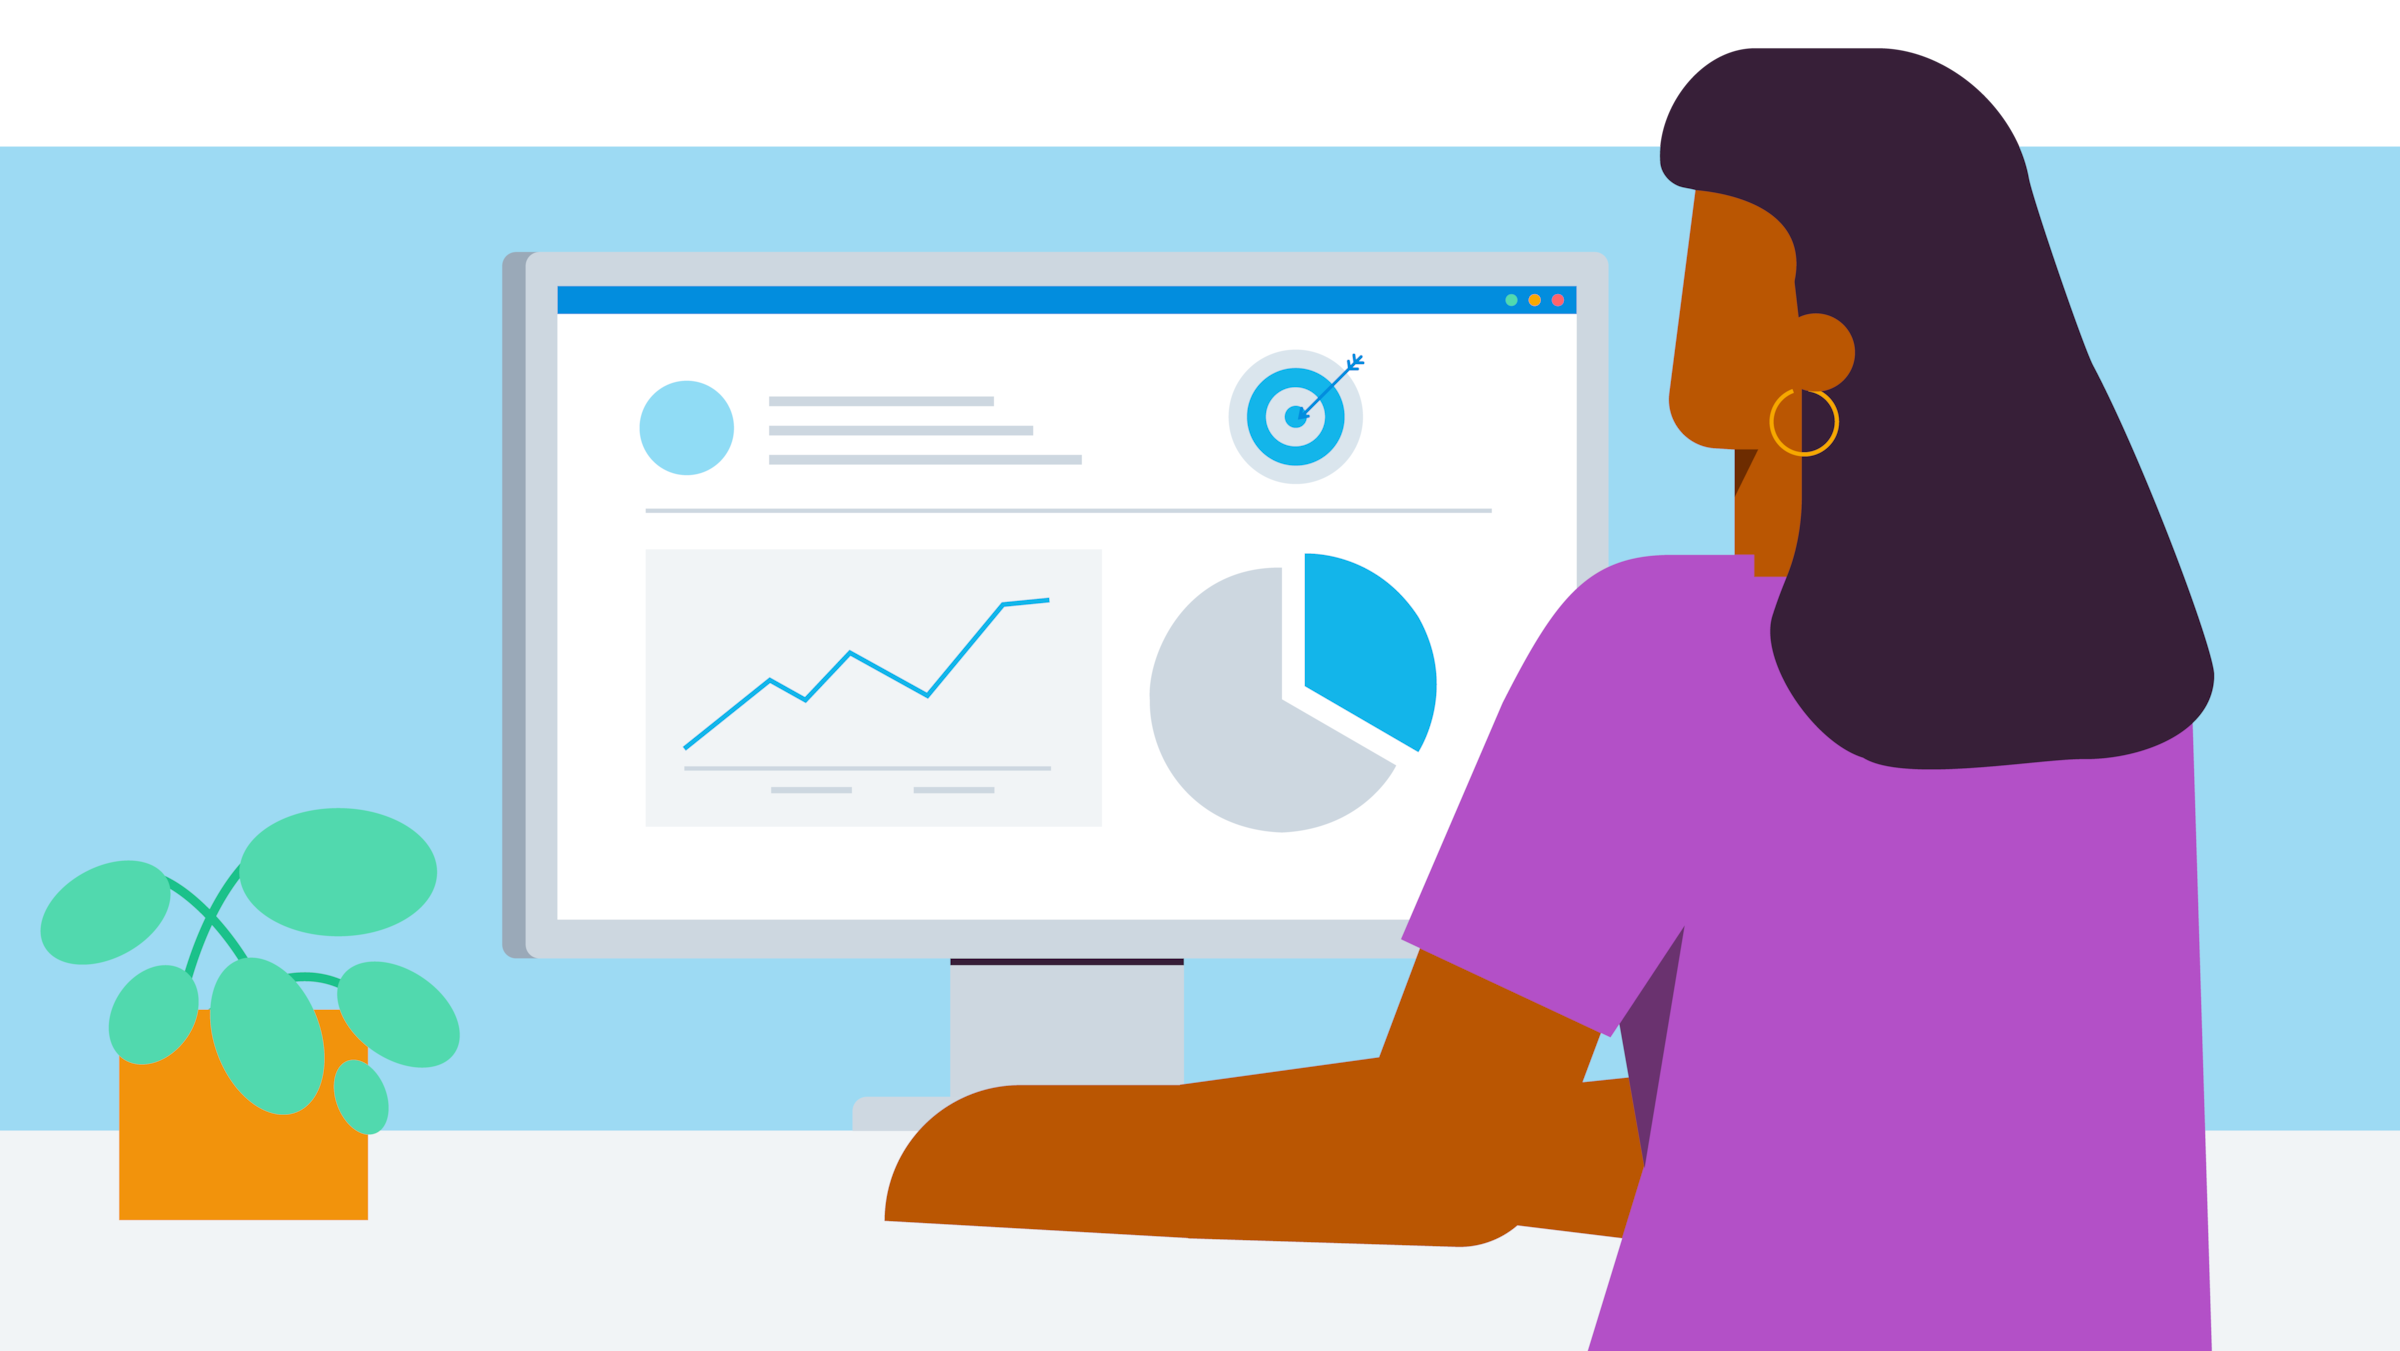
Cloud-based accounting software analytics can automate much of this tracking. Dashboards update in real time, so you can check your KPIs from anywhere. Your accountant can help interpret what the numbers mean and recommend actions.
Track your KPIs with Xero
The right KPIs give you clarity and confidence in your business decisions. Instead of wondering whether things are going well, you'll have data that shows exactly where you stand.
Tracking KPIs doesn't have to be complicated. Xero's cloud-based accounting software automatically pulls your financial data into clear dashboards. You can see your key metrics in real time, from anywhere, on any device.
With Xero, you can:
- view cash flow at a glance: see money coming in and going out without digging through reports
- track performance over time: compare this month to last month or last year
- share insights with your accountant: give them direct access to help you interpret the numbers
- set up custom reports: focus on the KPIs that matter most to your business
Ready to track your KPIs effortlessly? Get one month free with Xero and start making data-driven decisions today.
FAQs on KPIs
Here are answers to common questions about key performance indicators.
How many KPIs should a small business track?
Most small businesses should track five to eight KPIs. Fewer than five may miss important areas; more than ten often creates confusion and dilutes focus.
What's the difference between a metric and a KPI?
All KPIs are metrics, but not all metrics are KPIs. A metric is any measurable data point. A KPI is a metric that directly ties to your strategic goals and influences decisions.
How often should I review my KPIs?
Review operational KPIs weekly and financial KPIs monthly. Cash flow metrics may need daily attention during tight periods. The key is consistency rather than frequency.
What are the most important KPIs for small businesses?
The most common are gross profit margin, net profit margin, cash flow, debtor days, and customer retention rate. However, the right KPIs depend on your specific goals and industry.
Can I track KPIs without accounting software?
You can track KPIs manually using spreadsheets, but it's time-consuming and prone to errors. Cloud accounting software automates data collection and creates real-time dashboards, saving hours each month.
Disclaimer
Xero does not provide accounting, tax, business or legal advice. This guide has been provided for information purposes only. You should consult your own professional advisors for advice directly relating to your business or before taking action in relation to any of the content provided.
Start using Xero for free
Access Xero features for 30 days, then decide which plan best suits your business.