GP margin formula: how to calculate gross profit margin
Learn the gross profit margin formula to price smarter, reduce costs, and lift your bottom line.
Written by Lena Hanna—Trusted CPA Guidance on Accounting and Tax. Read Lena's full bio
Published Saturday 21 February 2026
Table of contents
Key takeaways
- Calculate your gross profit margin using the formula (Gross profit ÷ Revenue) × 100, where gross profit equals your total sales revenue minus cost of goods sold, to understand how much money you keep from each sale after covering direct costs.
- Track your gross profit margin monthly or quarterly to spot trends like rising costs or pricing opportunities, and benchmark against industry standards which typically range from 25% to 50% for most small businesses.
- Improve your margins by strategically raising prices on high-demand products, negotiating better supplier deals, or streamlining operations through automation and inventory optimisation.
- Use gross profit margin analysis to make informed decisions about your product mix, focusing resources on higher-margin offerings while identifying which products or services need pricing adjustments or cost reductions.
What is gross profit margin?
Gross profit margin is the percentage of sales revenue remaining after you subtract the cost of goods sold (COGS), though the exact calculation may differ slightly between International Financial Reporting Standards (IFRS) and US Generally Accepted Accounting Principles (US GAAP) accounting standards. It shows how efficiently your business produces and sells products or services.

This metric reveals:
- Profitability by product or service: which offerings generate the most profit
- Pricing effectiveness: whether your prices cover costs and leave room for growth
- Cost efficiency: how well you manage production and delivery expenses
Higher gross profit margins make it easier to cover operating expenses like rent and utilities, improving your chances of turning a net profit.
Why gross profit margin matters for your business
Gross profit margin reveals whether your pricing covers costs and leaves enough profit to grow. It's one of the first metrics investors, lenders, and accountants look at when assessing business health.
Your gross profit margin tells you:
- Pricing power: whether you can raise prices without losing customers
- Cost control: how efficiently you manage supplier and production costs
- Growth potential: whether you have enough margin to invest in expansion, hiring, or new products
- Cash flow health: higher margins typically mean more cash available for operations
Tracking your margin over time helps you identify opportunities early, like renegotiating supplier costs or adjusting pricing to stay competitive.
How to calculate gross profit margin
Calculating your gross profit margin involves a simple formula. The following sections explain the formula and walk you through the calculation step by step.
Gross profit margin formula
Gross profit margin formula:
Gross profit margin = (Gross profit ÷ Revenue) × 100
Where:
- Gross profit = Revenue minus cost of goods sold (COGS)
- Revenue = Total sales income before any deductions
Step-by-step calculation guide
Follow these steps to calculate your gross profit margin:
- Find your total revenue: Add up all sales income for the period you're measuring.
- Calculate your cost of goods sold (COGS): Include direct costs like materials, labour, and production expenses.
- Subtract COGS from revenue: This gives you your gross profit in dollars.
- Divide gross profit by revenue: This converts your profit to a decimal.
- Multiply by 100: This gives you your gross profit margin as a percentage.
Gross profit margin example calculation
This example shows the calculation for a cleaning business:
- Revenue: $20,000 (from cleaning offices)
- COGS: $8,000 (labour, supplies, equipment)
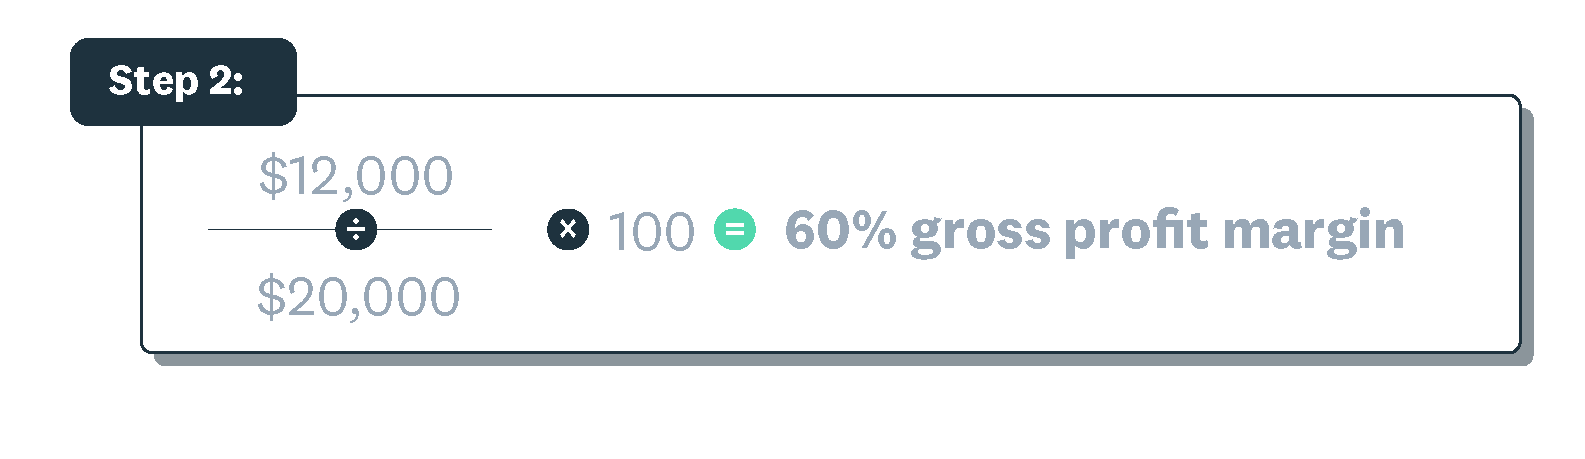
- Gross profit: $20,000 − $8,000 = $12,000
- Gross profit margin: ($12,000 ÷ $20,000) × 100 = 60%
A 60% gross profit margin means you keep 60 cents from every dollar of sales after covering direct costs.

Avoid common calculation mistakes
Make sure you estimate your COGS correctly, as it strongly affects the gross profit margin calculation.
Gross profit margin vs gross profit
For example, if your gross profit is $12,000 on $20,000 in sales:
- Gross profit: $12,000 (a dollar amount)
- Gross profit margin: 60% (a percentage)
The percentage makes it easier to compare performance across time periods or against competitors of different sizes. You may also hear "gross margin" used interchangeably with gross profit margin.
Other profit metrics like operating profit margin and net profit margin measure profitability after additional expenses. This article focuses on gross profit margin.
What is a good gross profit margin?
A good gross profit margin typically ranges from 25% to 50% for most small businesses, though this varies significantly by industry. Service businesses, which have minimal COGS, often have higher gross margins of 50% or more, while capital-intensive industries like retail and manufacturing may operate at 20% to 40% due to costs for inventory and production.
Your target margin depends on:
- Industry norms: some sectors have structurally higher or lower margins
- Business size: larger businesses may accept lower margins due to volume
- Market conditions: competitive pressure can squeeze margins
Your gross profit margin needs to cover operating expenses (rent, utilities, salaries) and taxes while leaving room for profit.
Industry benchmarks for gross profit margin
Gross profit margins vary significantly by sector:
- Jewellery and cosmetics: often exceed 55%
- Professional services: typically 50% to 70%
- Restaurants and hospitality: usually 25% to 40%
- Retail: generally 25% to 50%
- Electronics: often below 45%
- Alcoholic beverages: typically below 45%
Your accountant or bookkeeper can help you find benchmarks for similar-sized businesses in your industry. They can also clarify what margin your business should aim for.
Factors that affect your margins
Several factors influence your gross profit margin:
- Industry structure: hospitality has high overhead and low product costs, while financial services have lower overhead and higher fees
- Geographic region: costs, taxes, and customer volume vary by location
- Business model: ecommerce stores typically have lower overhead than physical retail, enabling higher margins; in fact, the average store today operates around a 60 to 65% gross margin.
- Market competition: intense competition in sectors like electronics retail drives down prices and squeezes margins
- Supplier costs: rising material or labour costs directly reduce your margin
Understanding these factors helps you set realistic targets.
Benchmarking your gross profit margin
For a realistic picture of your performance, benchmark your business against competitors in your industry. You'll get the clearest picture if you compare against similar-sized businesses that operate in the same industry, market or region.
Analysing gross profit margin for business insights
Gross profit margin analysis helps you identify which products, services, or business areas generate the most profit and where you have opportunities to improve performance.
Use your margin data to make decisions about:
- Pricing adjustments: raise prices on high-demand items or reduce prices to increase volume
- Cost management: negotiate with suppliers or find more efficient production methods
- Product mix: focus on higher-margin offerings and optimise your product range
Once you understand your margin data, you can interpret trends over time.
Interpreting gross profit margin trends
Track your gross profit margin monthly or quarterly to spot patterns:
- Rising margins: may indicate successful price increases, better supplier deals, or improved efficiency
- Declining margins: may indicate opportunities to address rising costs, competitive positioning, or pricing strategy
- Seasonal fluctuations: help you plan inventory and staffing around predictable demand changes
- Product-level variation: shows which offerings drive profitability and which have room for improvement
Consistent tracking helps you identify opportunities early and protect your cash flow.
When to reassess your gross profit margin
Review your gross profit margin when:
- Costs change: supplier prices increase or you switch vendors
- You adjust pricing: after raising or lowering prices
- Sales patterns shift: seasonal changes or new competitors enter the market
- You want to hit targets: when revenue or profit goals need attention
- You're planning growth: before hiring, expanding, or launching new products
Accounting software like Xero financial reports makes it easy to track margins and spot changes quickly.
How to improve gross profit margin
Improving your gross profit margin puts more money back into your business for growth, hiring, or reserves. Three proven strategies can help.
Adjust your prices
Review your pricing regularly to ensure it reflects your costs and market position:
- Raise prices strategically: increase prices on high-demand products or services where customers are less price-sensitive
- Add value to justify higher prices: improve quality, add features, or bundle services
- Respond to competition: adjust pricing when competitors change theirs, while maintaining your value position
- Test price changes: try small increases and monitor the impact on sales volume
Reduce your cost of goods sold
Lowering your COGS directly increases your gross profit margin:
- Negotiate with suppliers: ask for bulk discounts, longer payment terms, or loyalty pricing
- Compare vendors regularly: get quotes from multiple suppliers to ensure competitive rates
- Optimise inventory: track stock closely to maximise freshness and maintain ideal levels
- Optimise production: find more efficient methods or materials without sacrificing quality
- Buy in bulk: purchase high-turnover items in larger quantities when cash flow allows
Streamline your operations
Operational efficiency reduces costs without cutting quality:
- Automate repetitive tasks: use accounting software like Xero to handle invoicing, reconciliation, and reporting
- Reduce administrative overhead: digitise records and automate data entry, a practice that can reduce waste and manual effort, cutting annual data spend by 5% to 15% according to McKinsey.
- Track time and labour: identify inefficiencies in how staff time is spent, which is critical given that one UK study found the average office worker is only productive for 2 hours and 53 minutes each day.
- Review processes regularly: identify opportunities to speed up production or delivery
Understanding related profit metrics
Beyond gross profit margin, two other profit metrics help you assess business performance:
- Operating profit margin: measures profit after subtracting operating expenses (rent, utilities, salaries) from gross profit. Use it alongside gross margin for pricing and budgeting decisions.
- Net profit margin: shows your "bottom line" profit after all expenses, interest, and taxes. Use it for long-term financial planning and assessing overall business health.
Each metric builds on the previous one:
- Gross profit margin: revenue minus COGS
- Operating profit margin: gross profit minus operating expenses
- Net profit margin: operating profit minus interest and taxes
Businesses with consistently high net profit margins are typically more resilient to economic changes.
Use Xero to track your gross profit margin
Track your gross profit margin simply with Xero:
- Automated calculations: calculate your gross profit margin automatically from your sales and expense data
- Real-time reporting: see your margins update as you record transactions
- Customisable reports: break down margins by product, service, or time period
- Trend tracking: monitor how your margins change over time with visual dashboards
Save time on margin calculations with Xero. Get one month free when you try Xero today.
FAQs on gross profit margin
Common questions about gross profit margin, answered.
Is GP% the same as gross profit margin?
Yes, GP% (gross profit percentage) and gross profit margin refer to the same metric. Both express gross profit as a percentage of revenue.
What does a 40% gross profit margin mean?
A 40% gross profit margin means you keep 40 cents from every dollar of sales after paying for direct costs. The remaining 60 cents covers your cost of goods sold.
How often should I check my gross profit margin?
Review your gross profit margin monthly at minimum. Check it more frequently after price changes, when costs shift, or during seasonal fluctuations.
Can your gross profit margin be too high?
A very high margin may signal an opportunity to review your pricing strategy to optimise sales volume and maintain your competitive position. Balance margin with market competitiveness and customer demand.
How does Xero help me track gross profit margin?
Xero automatically calculates your gross profit margin from your financial data and displays it in real-time reports, so you can monitor trends without manual spreadsheets.
Disclaimer
Xero does not provide accounting, tax, business or legal advice. This guide has been provided for information purposes only. You should consult your own professional advisors for advice directly relating to your business or before taking action in relation to any of the content provided.