Profit and loss statement example
Learn how to prepare and analyse your profit and loss statement with our detailed profit and loss statement example (P&L example). Understanding the components of a profit and loss statement helps you accurately report your finances, supports your decisions, and helps make your business profitable.

What is a profit and loss statement?
A profit and loss statement, also known as a P&L statement and an income statement, is a financial performance report that shows whether a business is making money. It’s an overview of a business’s financial health – it outlines a business’s income vs expenses over a period, and shows if they’ve made a profit or loss in that time.
Regularly preparing and understanding your profit and loss statements can help you make informed financial decisions, by:
- Identifying areas where you can reduce costs
- Alerting you to areas of the business that are losing money
P&L statements can support loan applications or investment bids. They can help when preparing tax submissions too, as they contain financial details needed for filing your tax return, such as company income and expenses. Learning how to read financial reports like a profit and loss statement can therefore help you stay on top of your tax obligations.
Not all expenses on your P&L statement will be tax deductible, so it’s worth checking with your local government for more information on financial reporting and tax compliance.
Xero’s accounting software can automate the process of creating your P&L statement to keep your small business accounting simple.
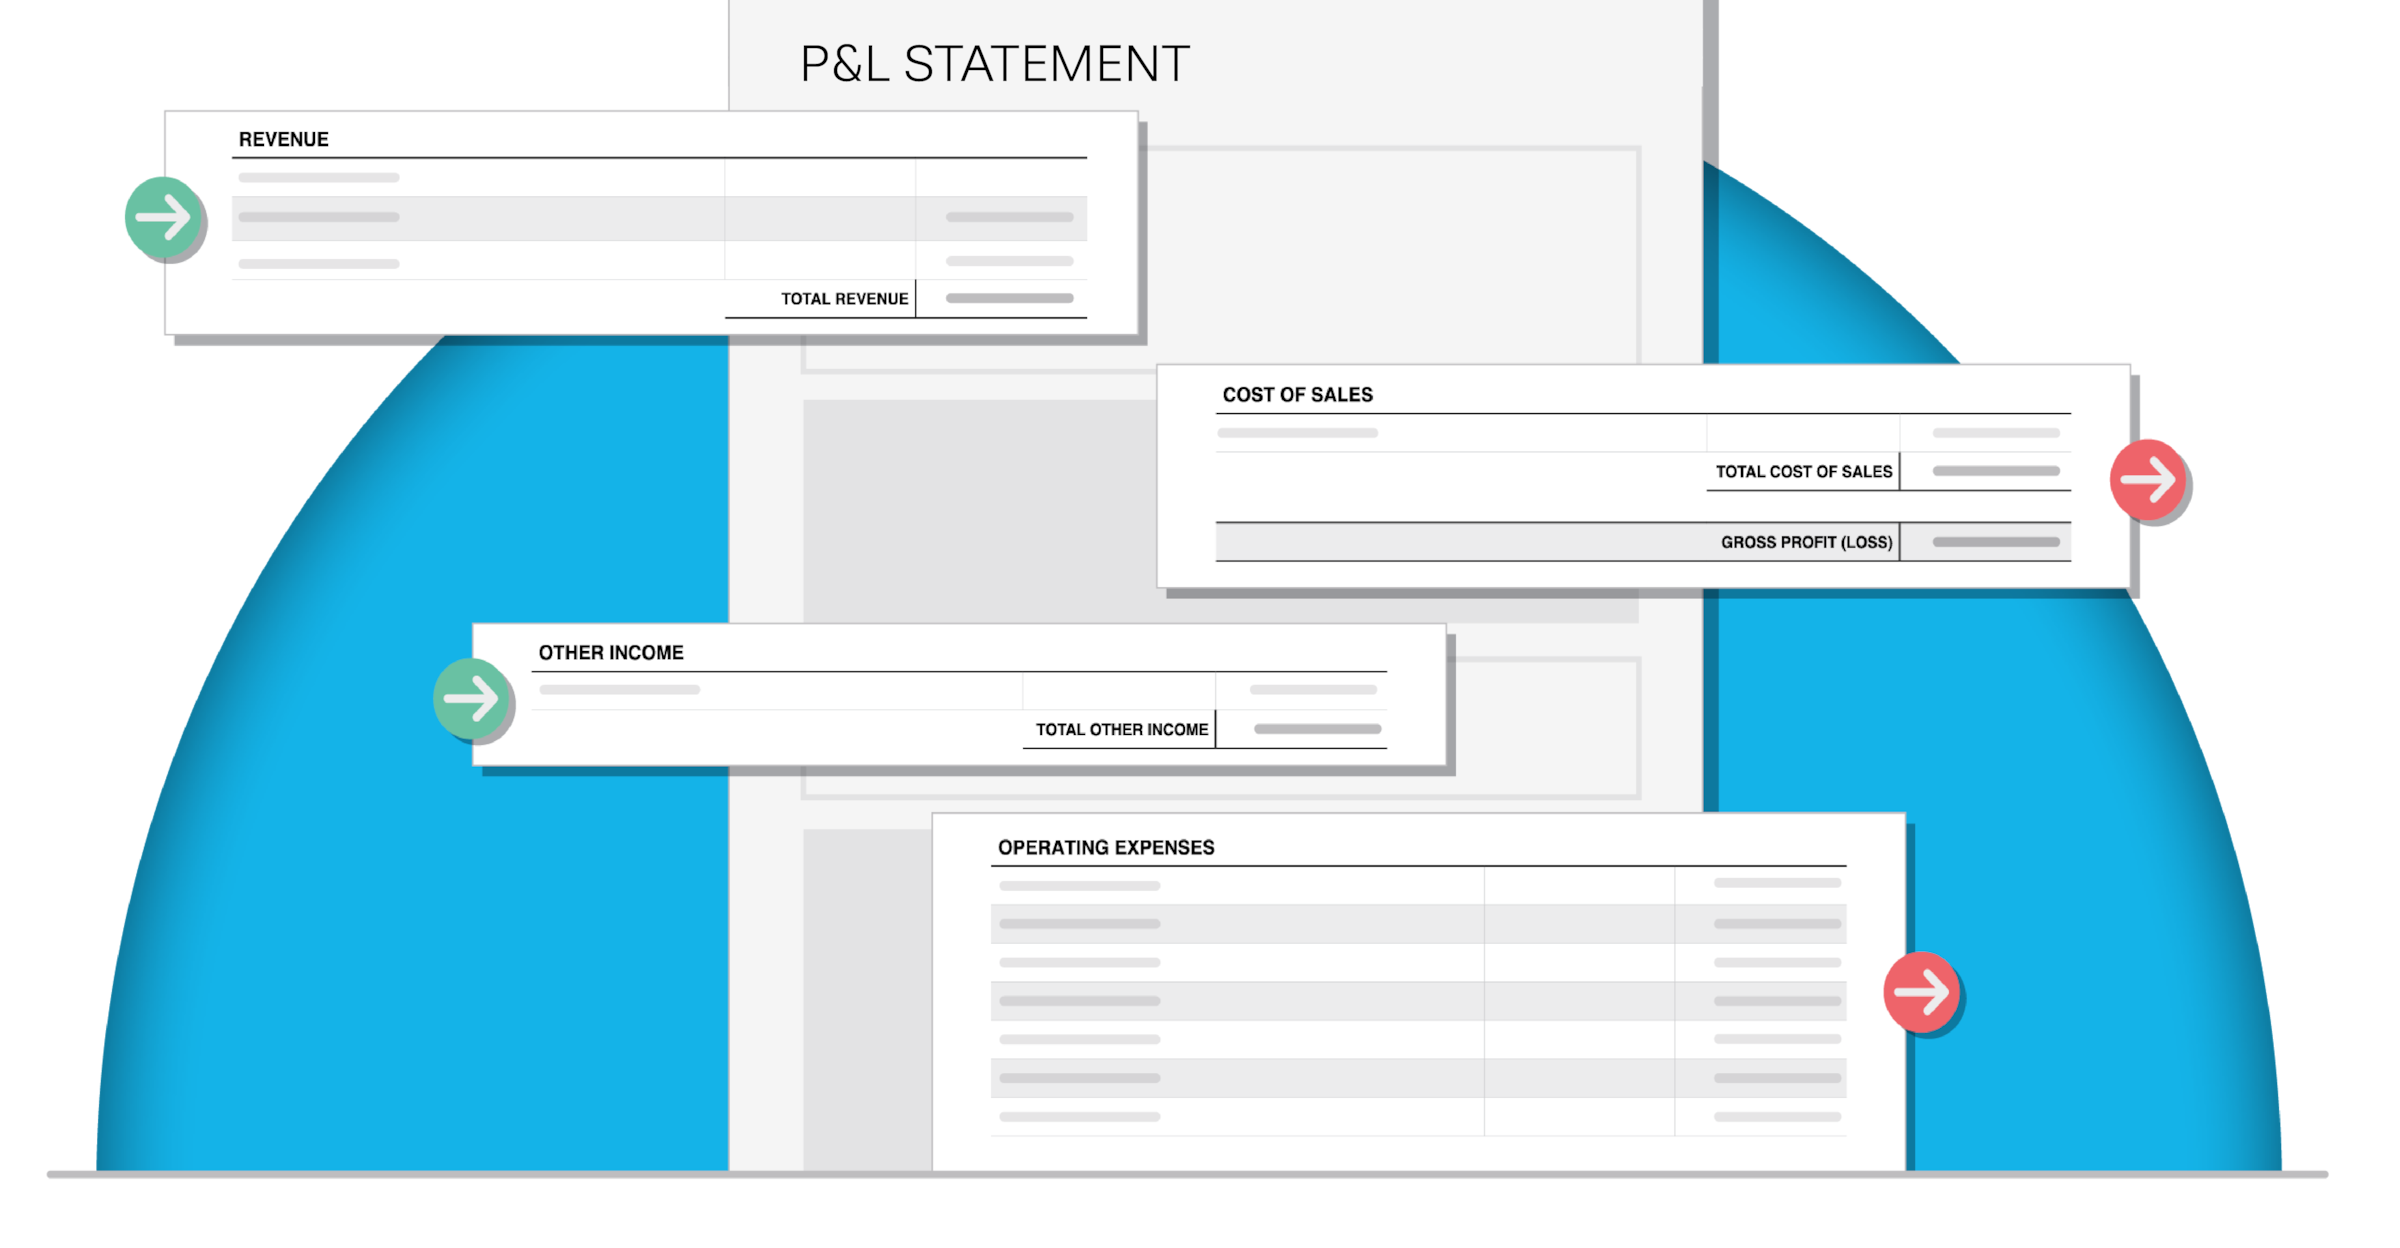
Understanding a profit and loss statement: key elements
Revenue

Revenue is the total income from sales before any expenses are deducted. To report your revenue in the profit and loss statement format:
- Gather all sales records from invoices, receipts, and bank statements
- Classify each sale by category, such as product type, service, or location
- Calculate the combined revenue for each category and sum them up for the total revenue
By reporting all sources of your income you’ll make your financial reporting more comprehensive, helping you track different parts of your business’s performance.
This is then useful for comparing sales performance over different periods, and could give you ideas on how to increase revenue by highlighting areas that perform better than others.
Cost of goods sold

Cost of goods sold (COGS) is the direct cost of producing goods, and refers to the products sold by your business. COGS expenses include:
- Raw materials, like the cost of items used to produce your goods
- Direct labour costs, such as the wages of employees directly involved in the production process
- Manufacturing overheads, like utilities costs, depreciation, and maintenance of equipment
To calculate COGS, subtract the cost of unsold inventory from the total costs.
The formula is:
Breaking down your COGS calculations by product or service makes it easier to perform a thorough profitability analysis as you can track your costs, forecast more accurately, and identify profitable products or services.
Here’s more information on COGS.
Gross profit

Gross profit is the difference between revenue and the cost of goods sold, and acts as a financial health indicator.
To calculate your gross profit, subtract your COGS costs from your revenue, as below:

- Positive gross profit proves that your business is covering its production costs, meaning it can cover its operating expenses and still generate a profit.
- Negative gross profit indicates a need to review pricing strategies or reduce production expenses, as your business is not covering its costs. You might need to raise prices or find cheaper raw materials.
Find more practical advice on how to increase profit.
Operating expenses

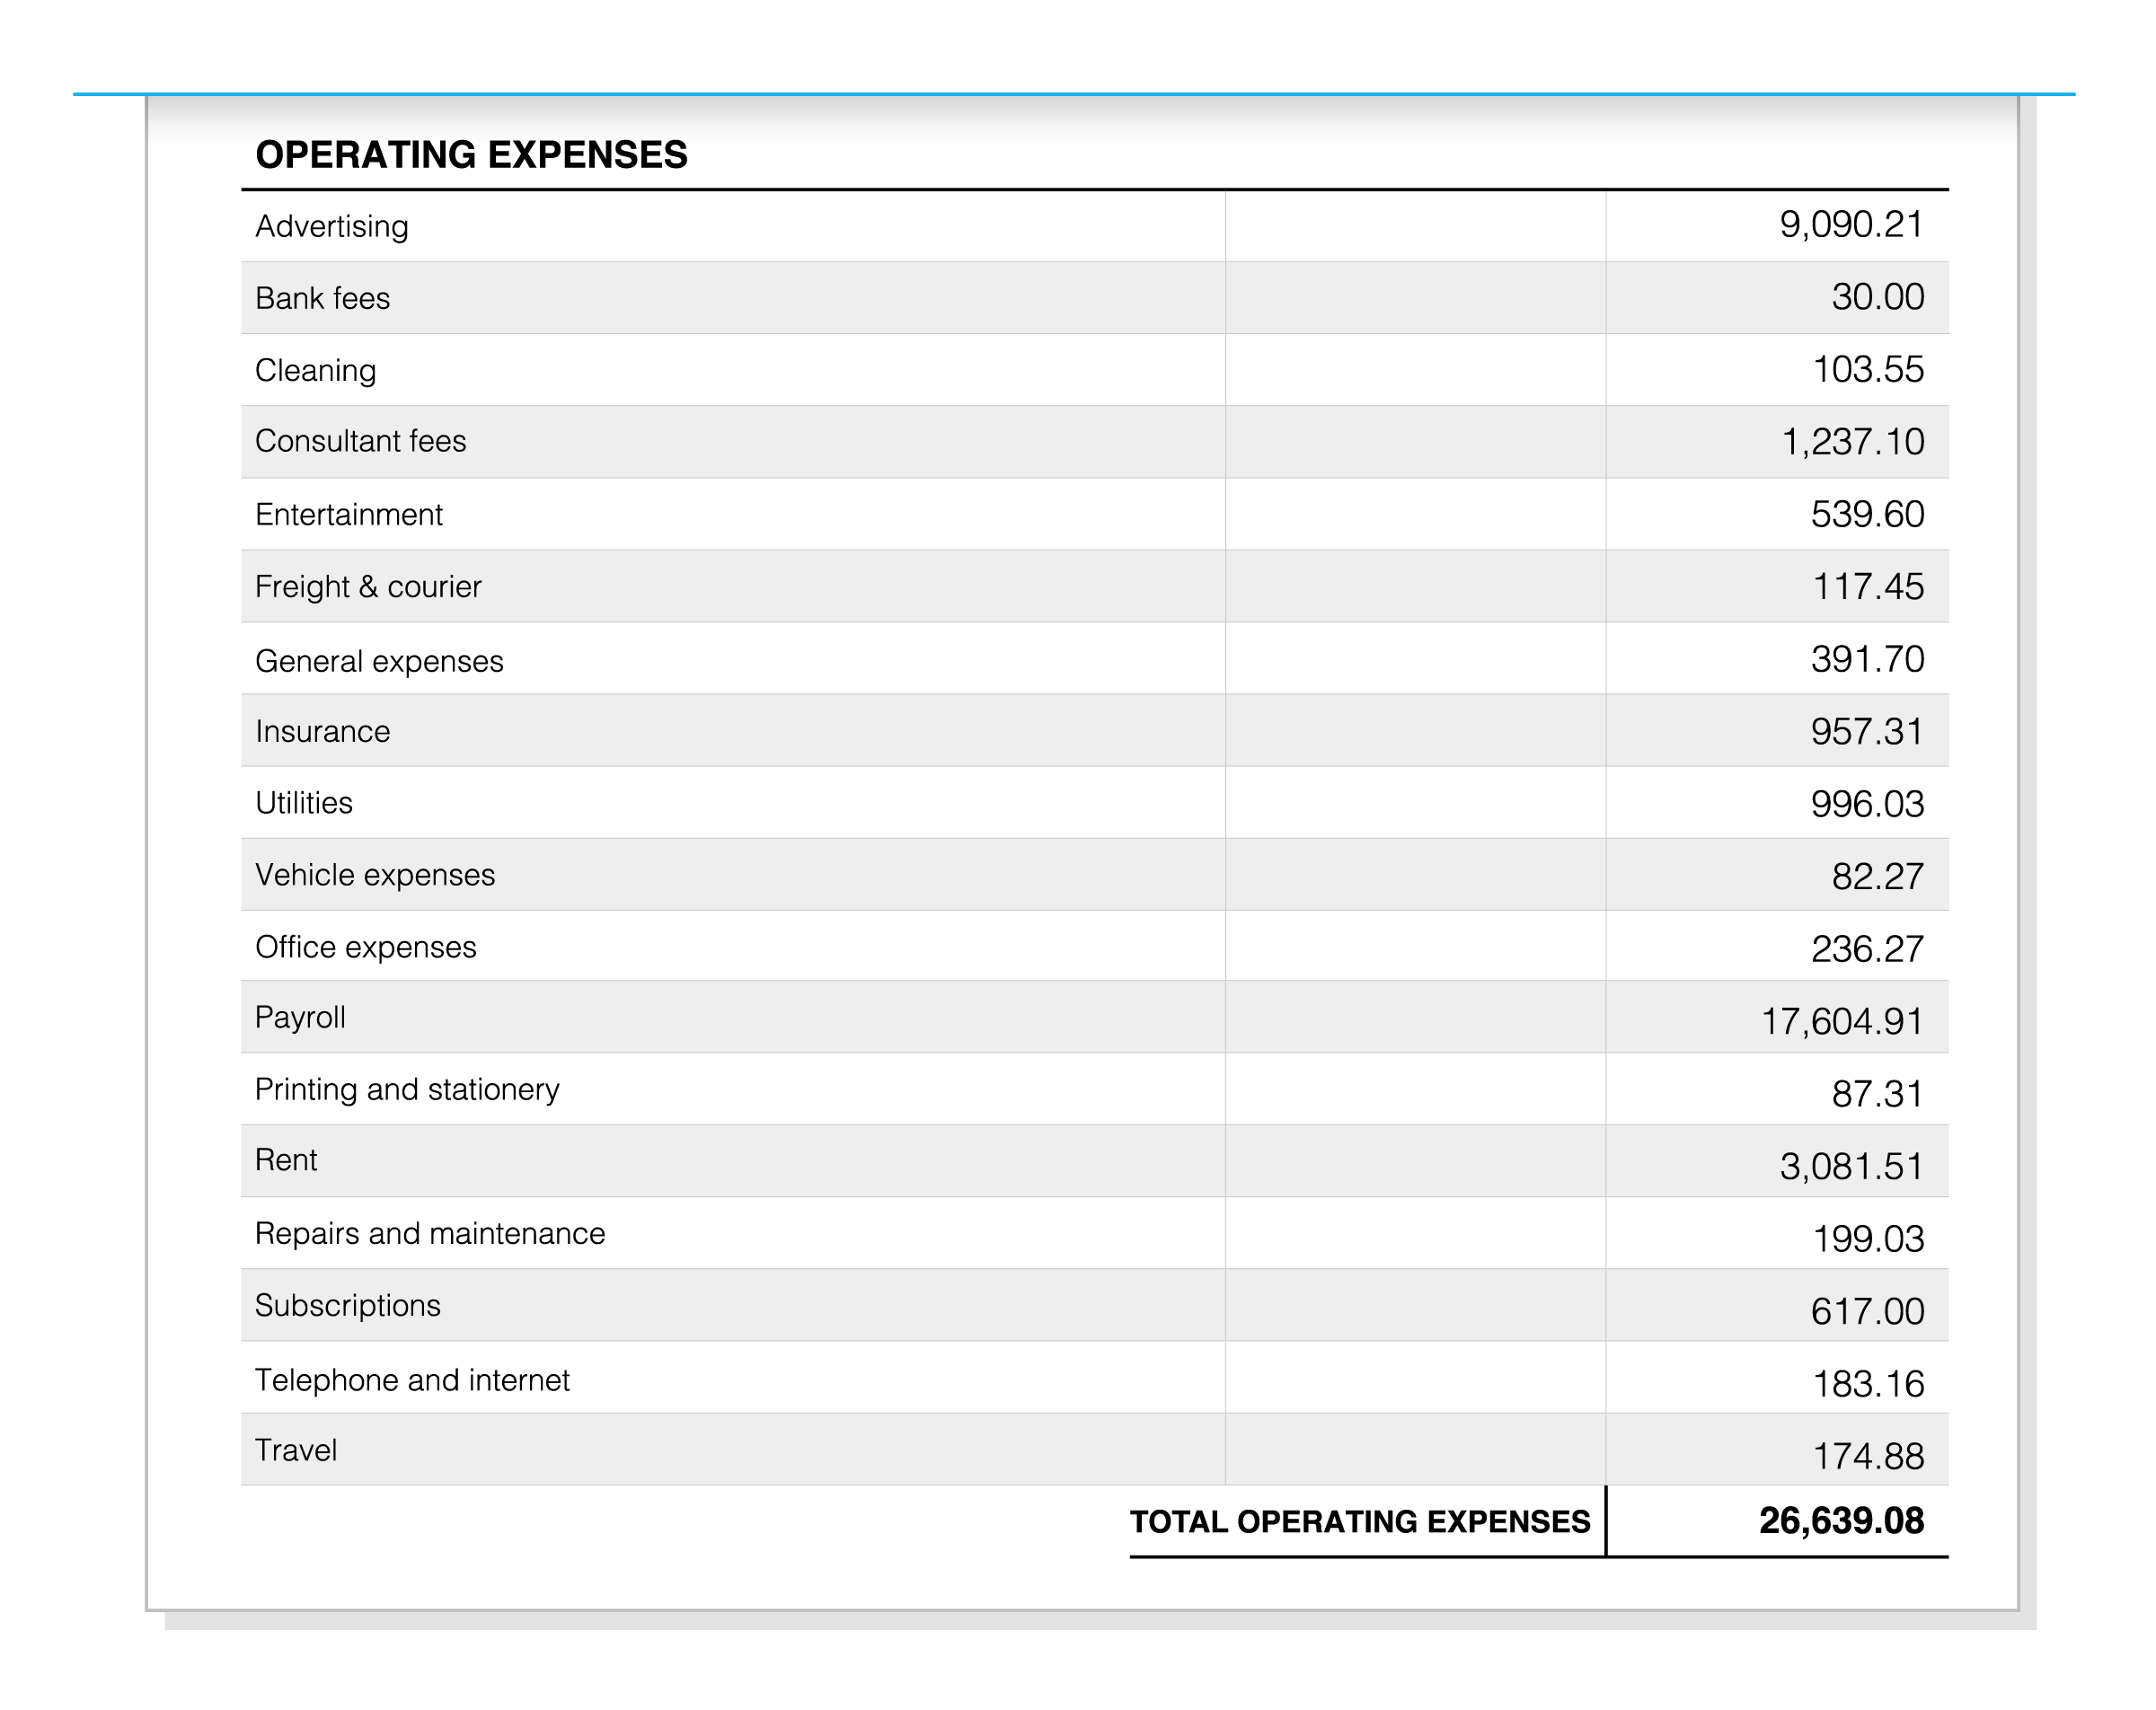
Operating expenses are the costs of running your business that are not directly linked to production. Common operating costs are:
- Rent, such as the cost of leasing an office
- Utilities – your electricity, water, and gas bills, for example
- Employee salaries, like administration and non-production staff wages
- Advertising costs
Tracking and managing your expenses helps keep your business’s finances healthy. To keep expenses under control, keep detailed records of all expenses, and regularly review them to identify areas where you can reduce costs.
Accounting software can help categorise and track your expenses. With Xero, you can connect your bank to your accounting to easily track your transactions.
Non-operating expenses
Non-operating expenses are costs that aren’t related to core business operations or production. like interest payments (the cost of borrowing money) and unusual, one-off expenses unrelated to regular business activities, like a corporate retreat.
Non-operating expenses can sneak up on business owners and affect their net profits and the financial health of their businesses. So regularly monitor and control these expenses to help keep your business profitable.
Profit before tax
Profit before tax is the operating profit minus non-operating expenses. You can use this equation to calculate it.

The formula is:
Profit before tax = Operating profit – Non-operating expenses
Knowing what your profit is before you’ve paid your taxes helps you estimate how much tax you owe. A clear picture of your tax liabilities and your before-tax profit keeps your financial reporting accurate and your business legally compliant.
Net income
Net income is the profit remaining after all costs, including taxes, have been deducted.
The formula is:
The final step in your profit calculation, net income measures your business’s overall profitability once every cost is accounted for. It’s a true reflection of your business’s performance, and is therefore important for understanding its financial health.

Measuring profitability, particularly net income, can help you to plan for future growth. Understanding profit and loss statements and regularly reviewing your net income informs your strategic decisions by highlighting trends and high-performing areas of the business.
For up-to-date tracking of your business finances, our bank reconciliation tools can give you a clear, accurate overview of your accounts.
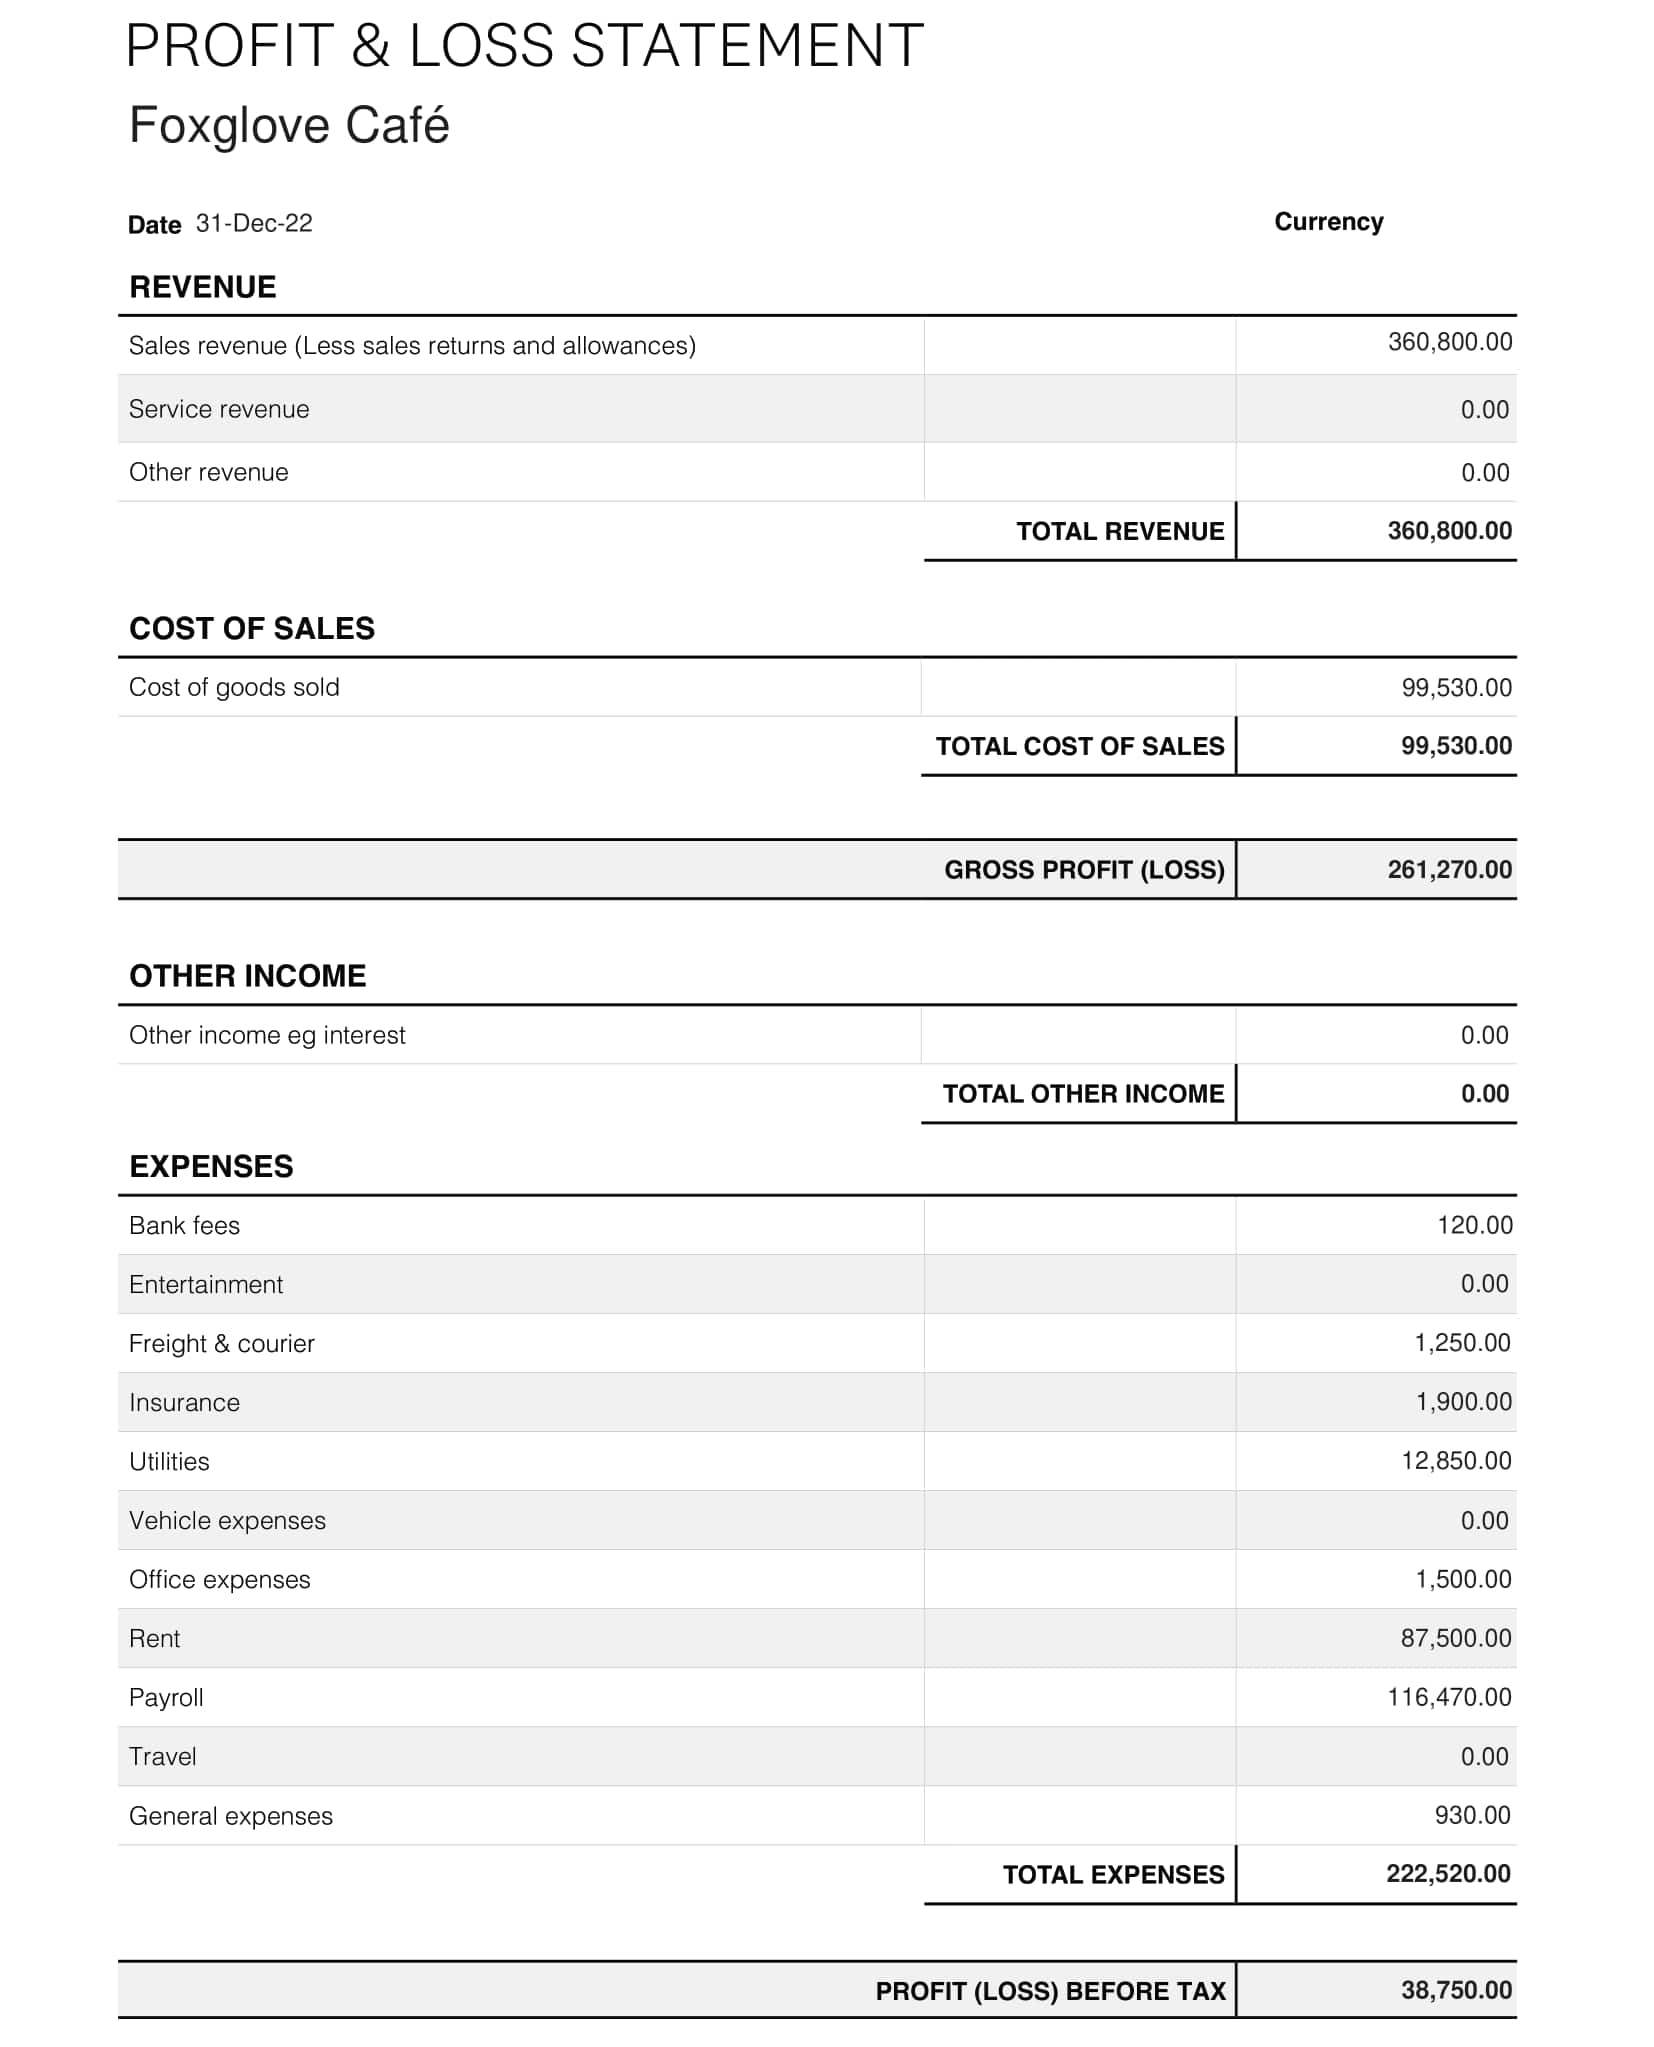
Profit and loss statement sample
P&L example FAQs

Get your free P&L template now
With customisable fields, automatic formulas and even a handy how-to guide, we’ve made it as easy as possible to sort your P&L statement.
Download templateWhat’s the difference between income and revenue?
Income and revenue are slightly different types of earnings. Income is a broader term that includes all types of earnings (not just revenue from sales) – for instance, it may include income from interest or investment gains. Revenue only refers to the earnings from core business activities, such as the sale of products or services.
What’s the difference between expenses and costs of goods sold?
Expenses and costs of goods sold are different things. ‘Expenses’ covers all costs used to run a business, including direct and indirect costs. Costs of goods sold, on the other hand, are just one part of your business expenses, and only come from the production of goods and services.
What is the difference between a profit and loss statement and a balance sheet?
A P&L statement is a summary of all revenue and expenses over a specific period, and shows net profit or loss within that period. A balance sheet is a snapshot of a business’s financial position at a specific point in time. It sets out assets, liabilities, and equity.
Where a P&L statement summarises profitability in a set period, a balance sheet measures the value of things owned by a business, including its retained earnings and the owner’s equity. A balance sheet therefore tells you if a business has gained or lost value over time.
For a complete picture of your business’s financial health, you should analyse its balance sheet and P&L statements together.
Download our free balance sheet template.
What should I do if my statement shows a loss?
Understanding your profit and loss statement and using it to analyse your business’s finances can help you identify areas where expenses are high and revenue is low.
If your statement shows a loss, pinpoint and reduce unnecessary expenses, and improve operational efficiency to help your profitability. Keep an eye on your revenue, too – to give it a boost, try exploring your sales and marketing strategies to find more effective ways to reach your core audience.
A business can’t last long if it’s making losses, so consult a professional financial advisor or accountant for advice that’s tailored to your business.
How can I compare my current profit and loss statement with previous periods?
It’s easy to compare your P&L statements across different time periods. Accounting software programs have comparative reports that let you view P&L statements side by side. Comparing your current business finances against previous periods not only helps you analyse your short-term profits, but also the ongoing profitability, trends, and financial health of your business.
Get to grips with your P&L with our free template and guide
You could create your own profit and loss template – or you could download Xero’s free P&L template that’s ready to edit straight away! It even comes with a how-to guide to help you analyse your statement to better understand your business’s financial health.
With Xero’s free download you can:
- Customise the format in your P&L statement without fuss
- Have a user-friendly template that you can use again and again
- Follow the how-to guide to analyse your business’s performance in each period
Upgrade your financial reports with Xero software
By regularly preparing a profit and loss statement, you’ll have a comprehensive overview of your business’s performance that’s essential at tax time. Understanding profit and loss statements also helps you to make better financial decisions to help your business grow.
A well-maintained P&L statement from Xero gives you valuable insights into your business performance. Xero’s software streamlines your financial processes by helping to:
Automate transaction data
Capture transactions automatically from your business bank account POS, invoicing software, or ecommerce shop with Hubdoc.
Analyse your statements
With a click of a button you can create and analyse your P&L statements.
Spot trends ahead of time
Quickly compare your latest results against previous time periods to see how the business is trending.
Download the free profit and loss template
Fill in the form to get a profit and loss template as an editable PDF. We’ll throw in a guide to help you use it.
Disclaimer
Xero does not provide accounting, tax, business or legal advice. This guide has been provided for information purposes only. You should consult your own professional advisors for advice directly relating to your business or before taking action in relation to any of the content provided.
Start using Xero for free
Access Xero features for 30 days, then decide which plan best suits your business.