United States Small Business Insights
This analysis focuses on core performance metrics of sales growth, late payments and time to be paid.

Small business performance varies across states
Published: 29 October 2026
The latest Xero Small Business Insights (XSBI) data for the US shows small business sales growth slowed in recent months, likely reflecting the impact on squeezed household budgets of higher-than-normal gas prices and rising interest rates. State data reveals the sales performance varied substantially across the country. Tennessee, Delaware and North Carolina all recorded sales growth above 9% year-over-year. In contrast, Florida, Pennsylvania and Washington all had sales lower than a year ago. National payment times were broadly unchanged from the previous quarter, with US small businesses continuing to have the second longest late payment times of the five countries tracked in XSBI.
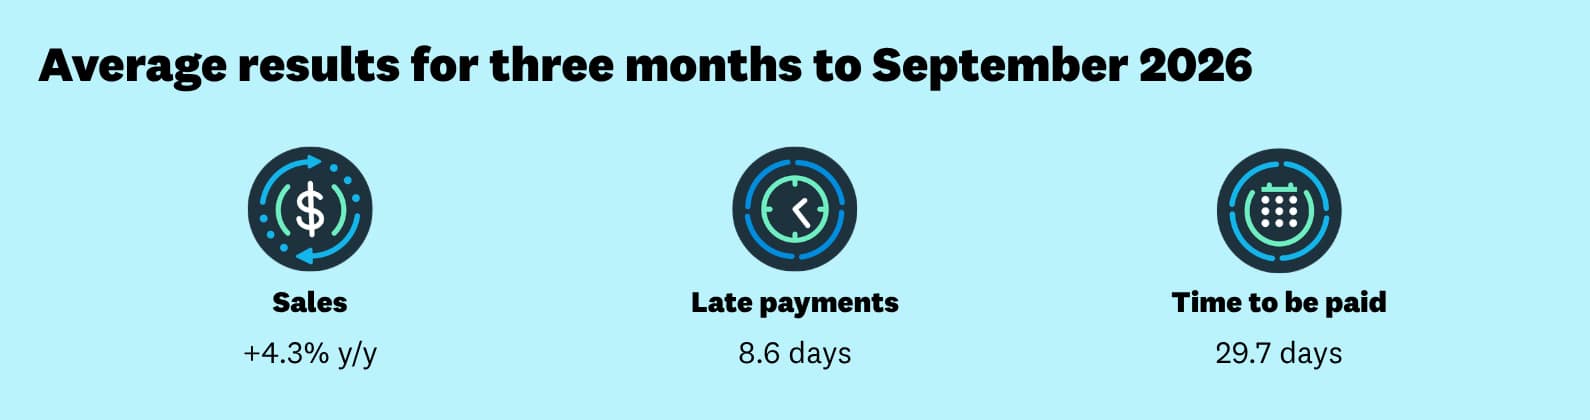
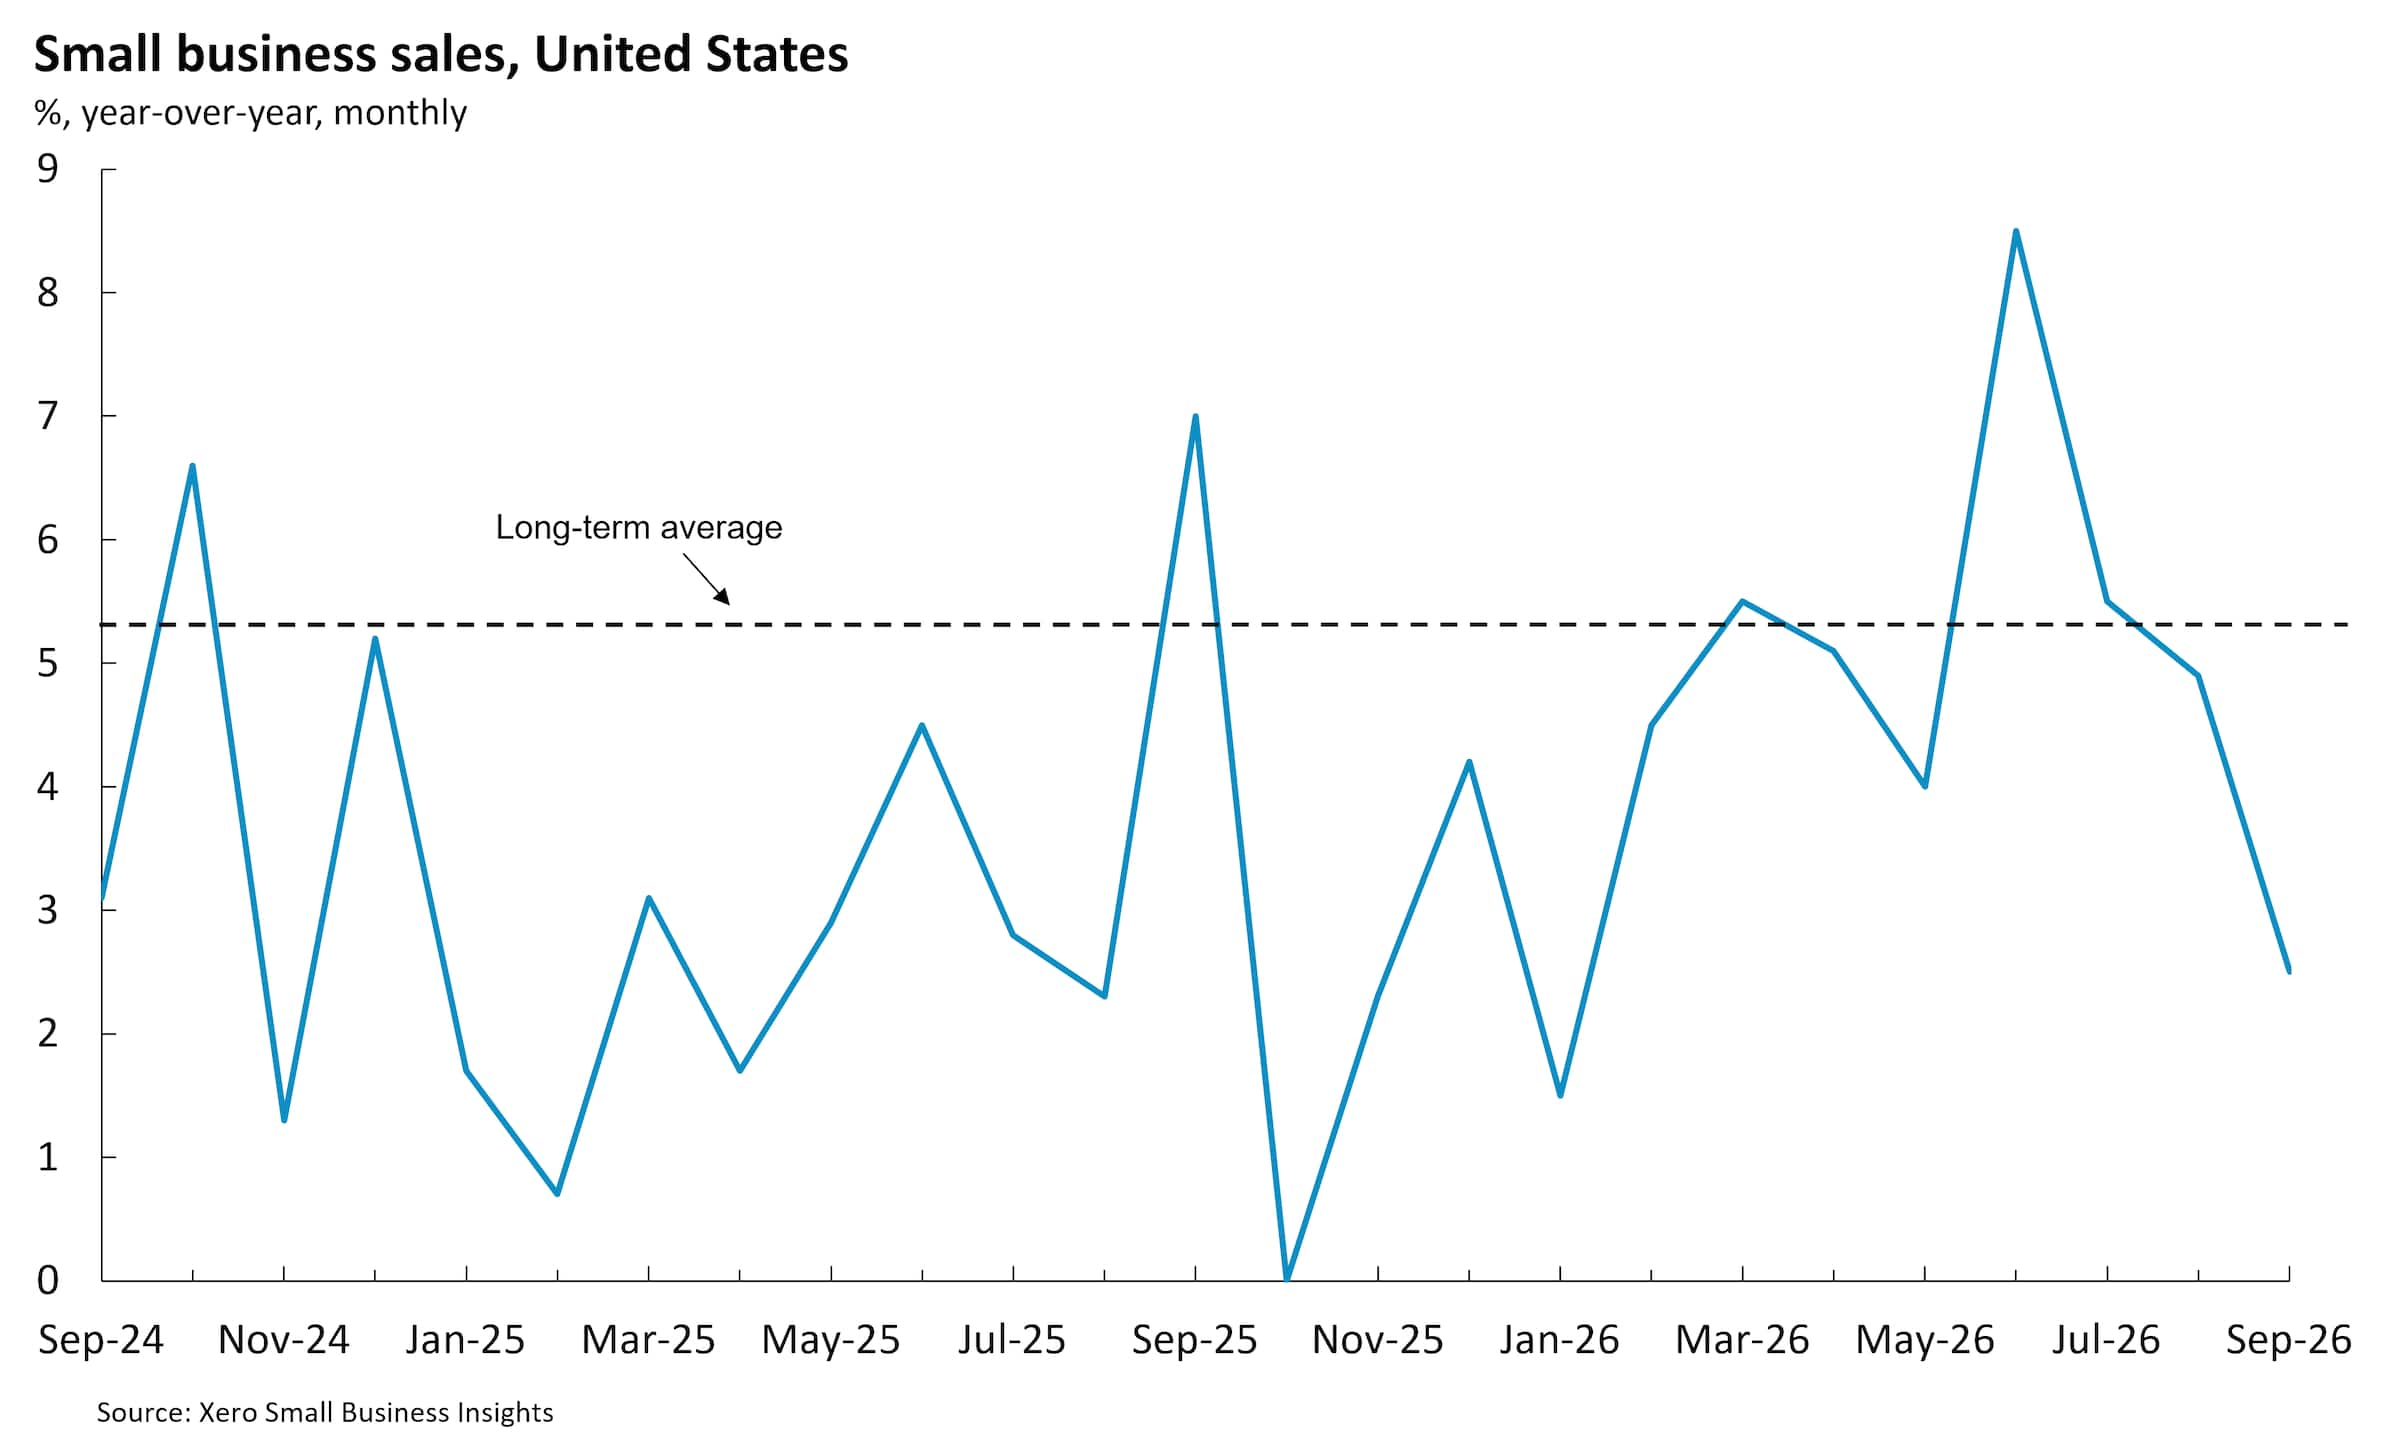
Small business sales rose 4.3% year-over-year (y/y) in the September quarter. This follows a 5.9% y/y rise in sales in the June quarter, largely due to a particularly strong month of June result (+8.5% y/y). That momentum didn't last into the next quarter, however, with sales growing a more modest 5.5% y/y in July, 4.9% y/y in August and only 2.5% y/y in September. During September the Federal Reserve's Fed Funds rate (25 bps to 3.75-4%) increased, having the effect of making borrowing more expensive for households and businesses. The sales slowdown also likely reflects the ongoing impact of higher-than-normal gas prices which is feeding into inflation more broadly and limiting the capacity of households to spend.
State data reveals the sales performance varied substantially across the country
XSBI US July 2026 - Sept 2026 data
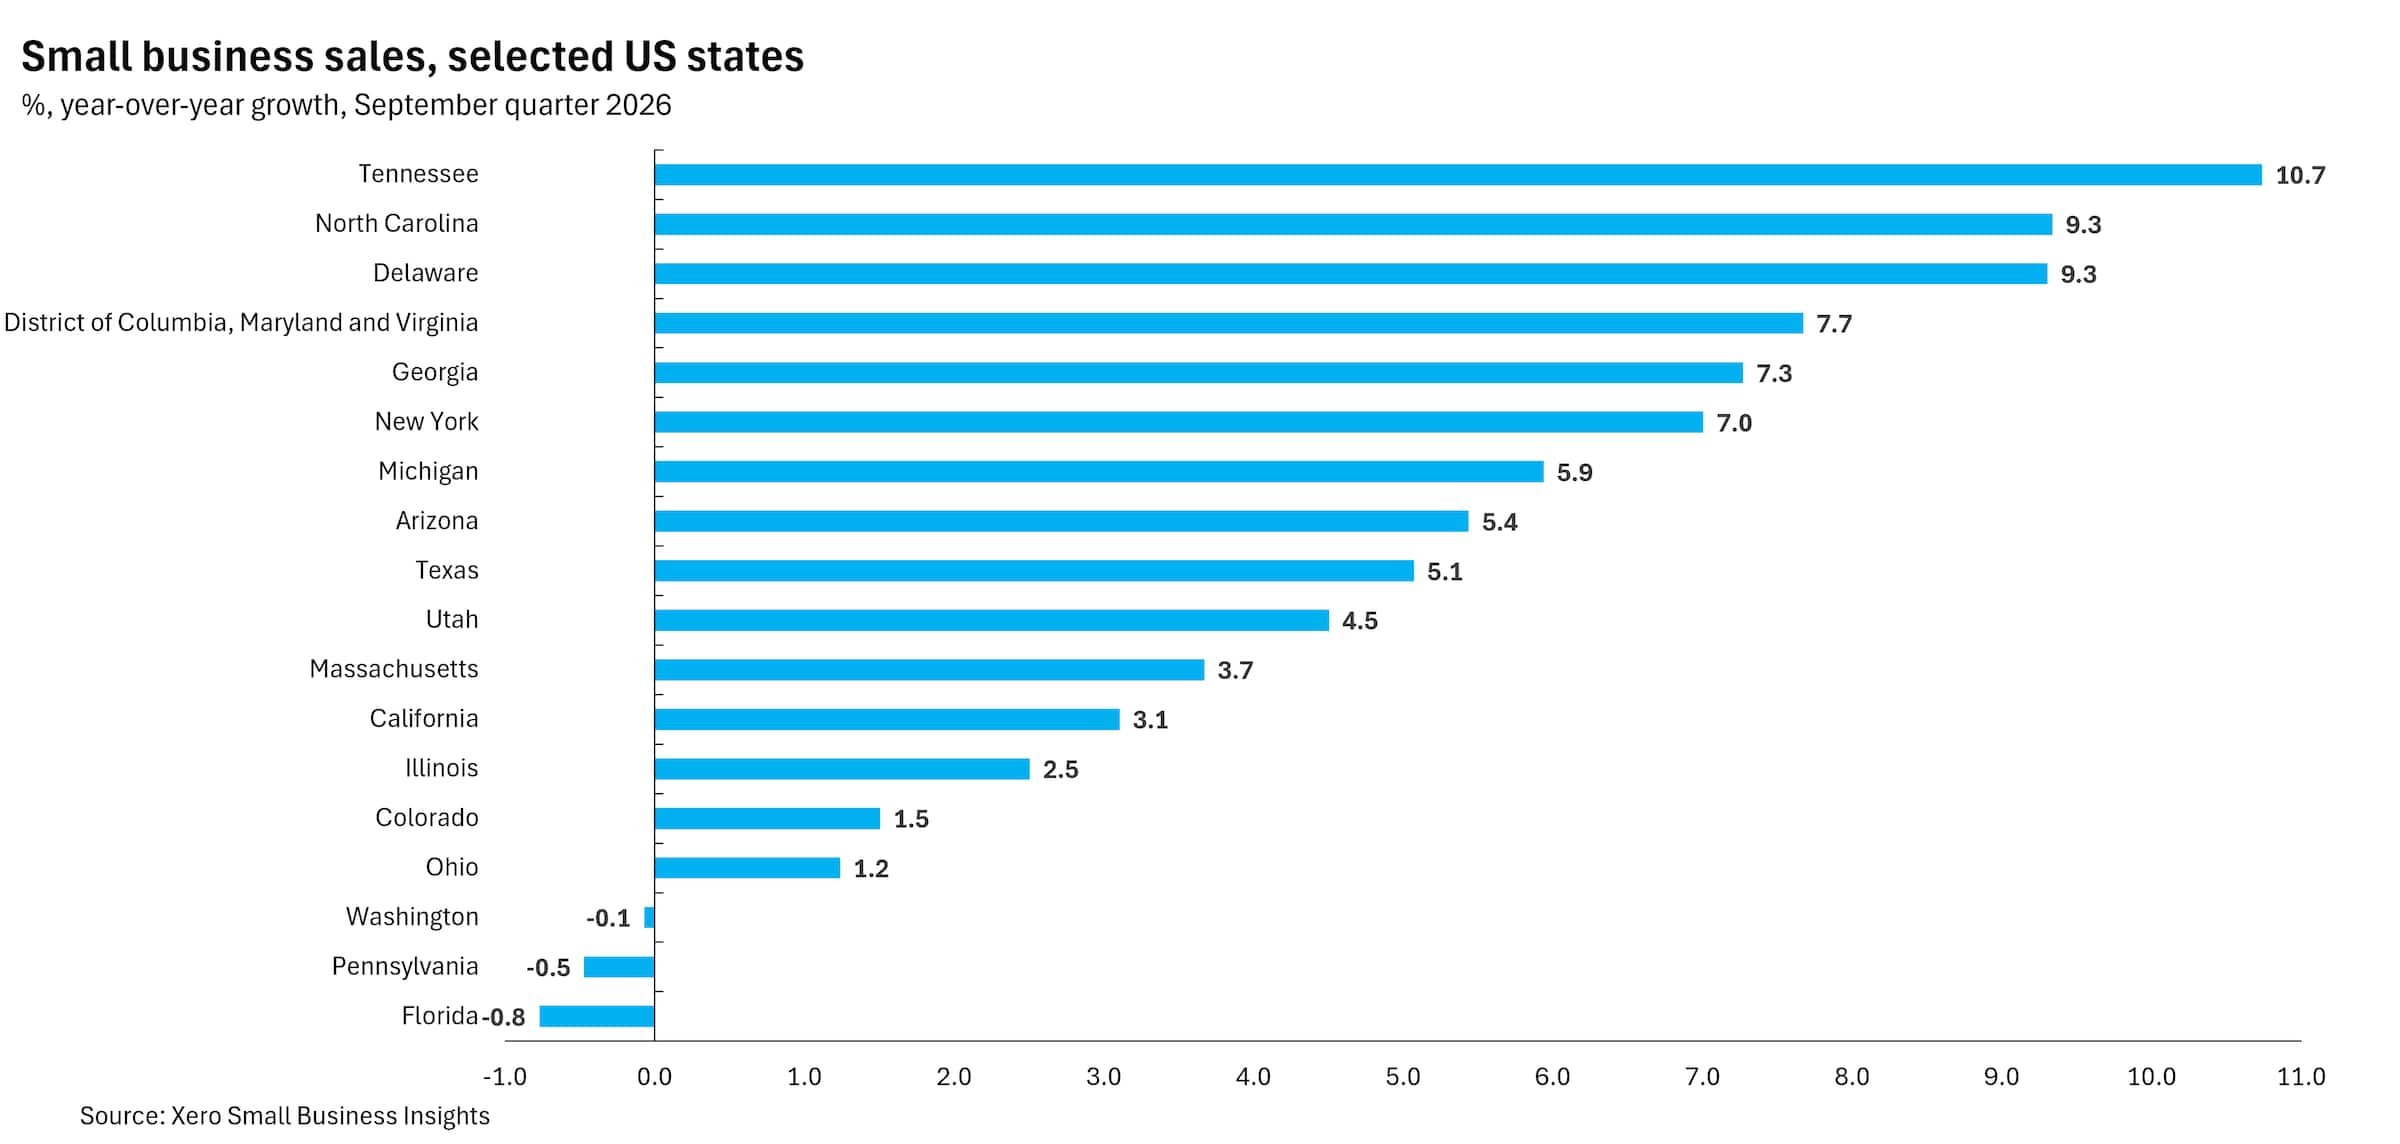
The state results showed considerable variation across the 18 tracked by XSBI. The best performer in the September quarter was Tennessee (+10.7% y/y), closely followed by Delaware (+9.3% y/y) and North Carolina (+9.3% y/y). Other states that recorded sales growth well above the national average include the combined region of the District of Columbia, Maryland and Virginia (+7.7% y/y), Georgia (+7.3% y/y) New York (+7.0% y/y) and Michigan (+5.9% y/y). In contrast, small businesses in Florida (-0.8% y/y, Pennsylvania (-0.5% y/y) and Washington (-0.1% y/y) all had sales lower than they were in the September quarter 2025. Ohio (+1.2% y/y), Colorado (+1.5% y/y) and Illinois (+2.5% y/y) had only small sales lifts in the previous 12 months. The biggest improvement between the June and September quarters was in Utah - with sales rising 4.5% y/y in the September quarter after a 2.6% y/y fall in the June quarter.
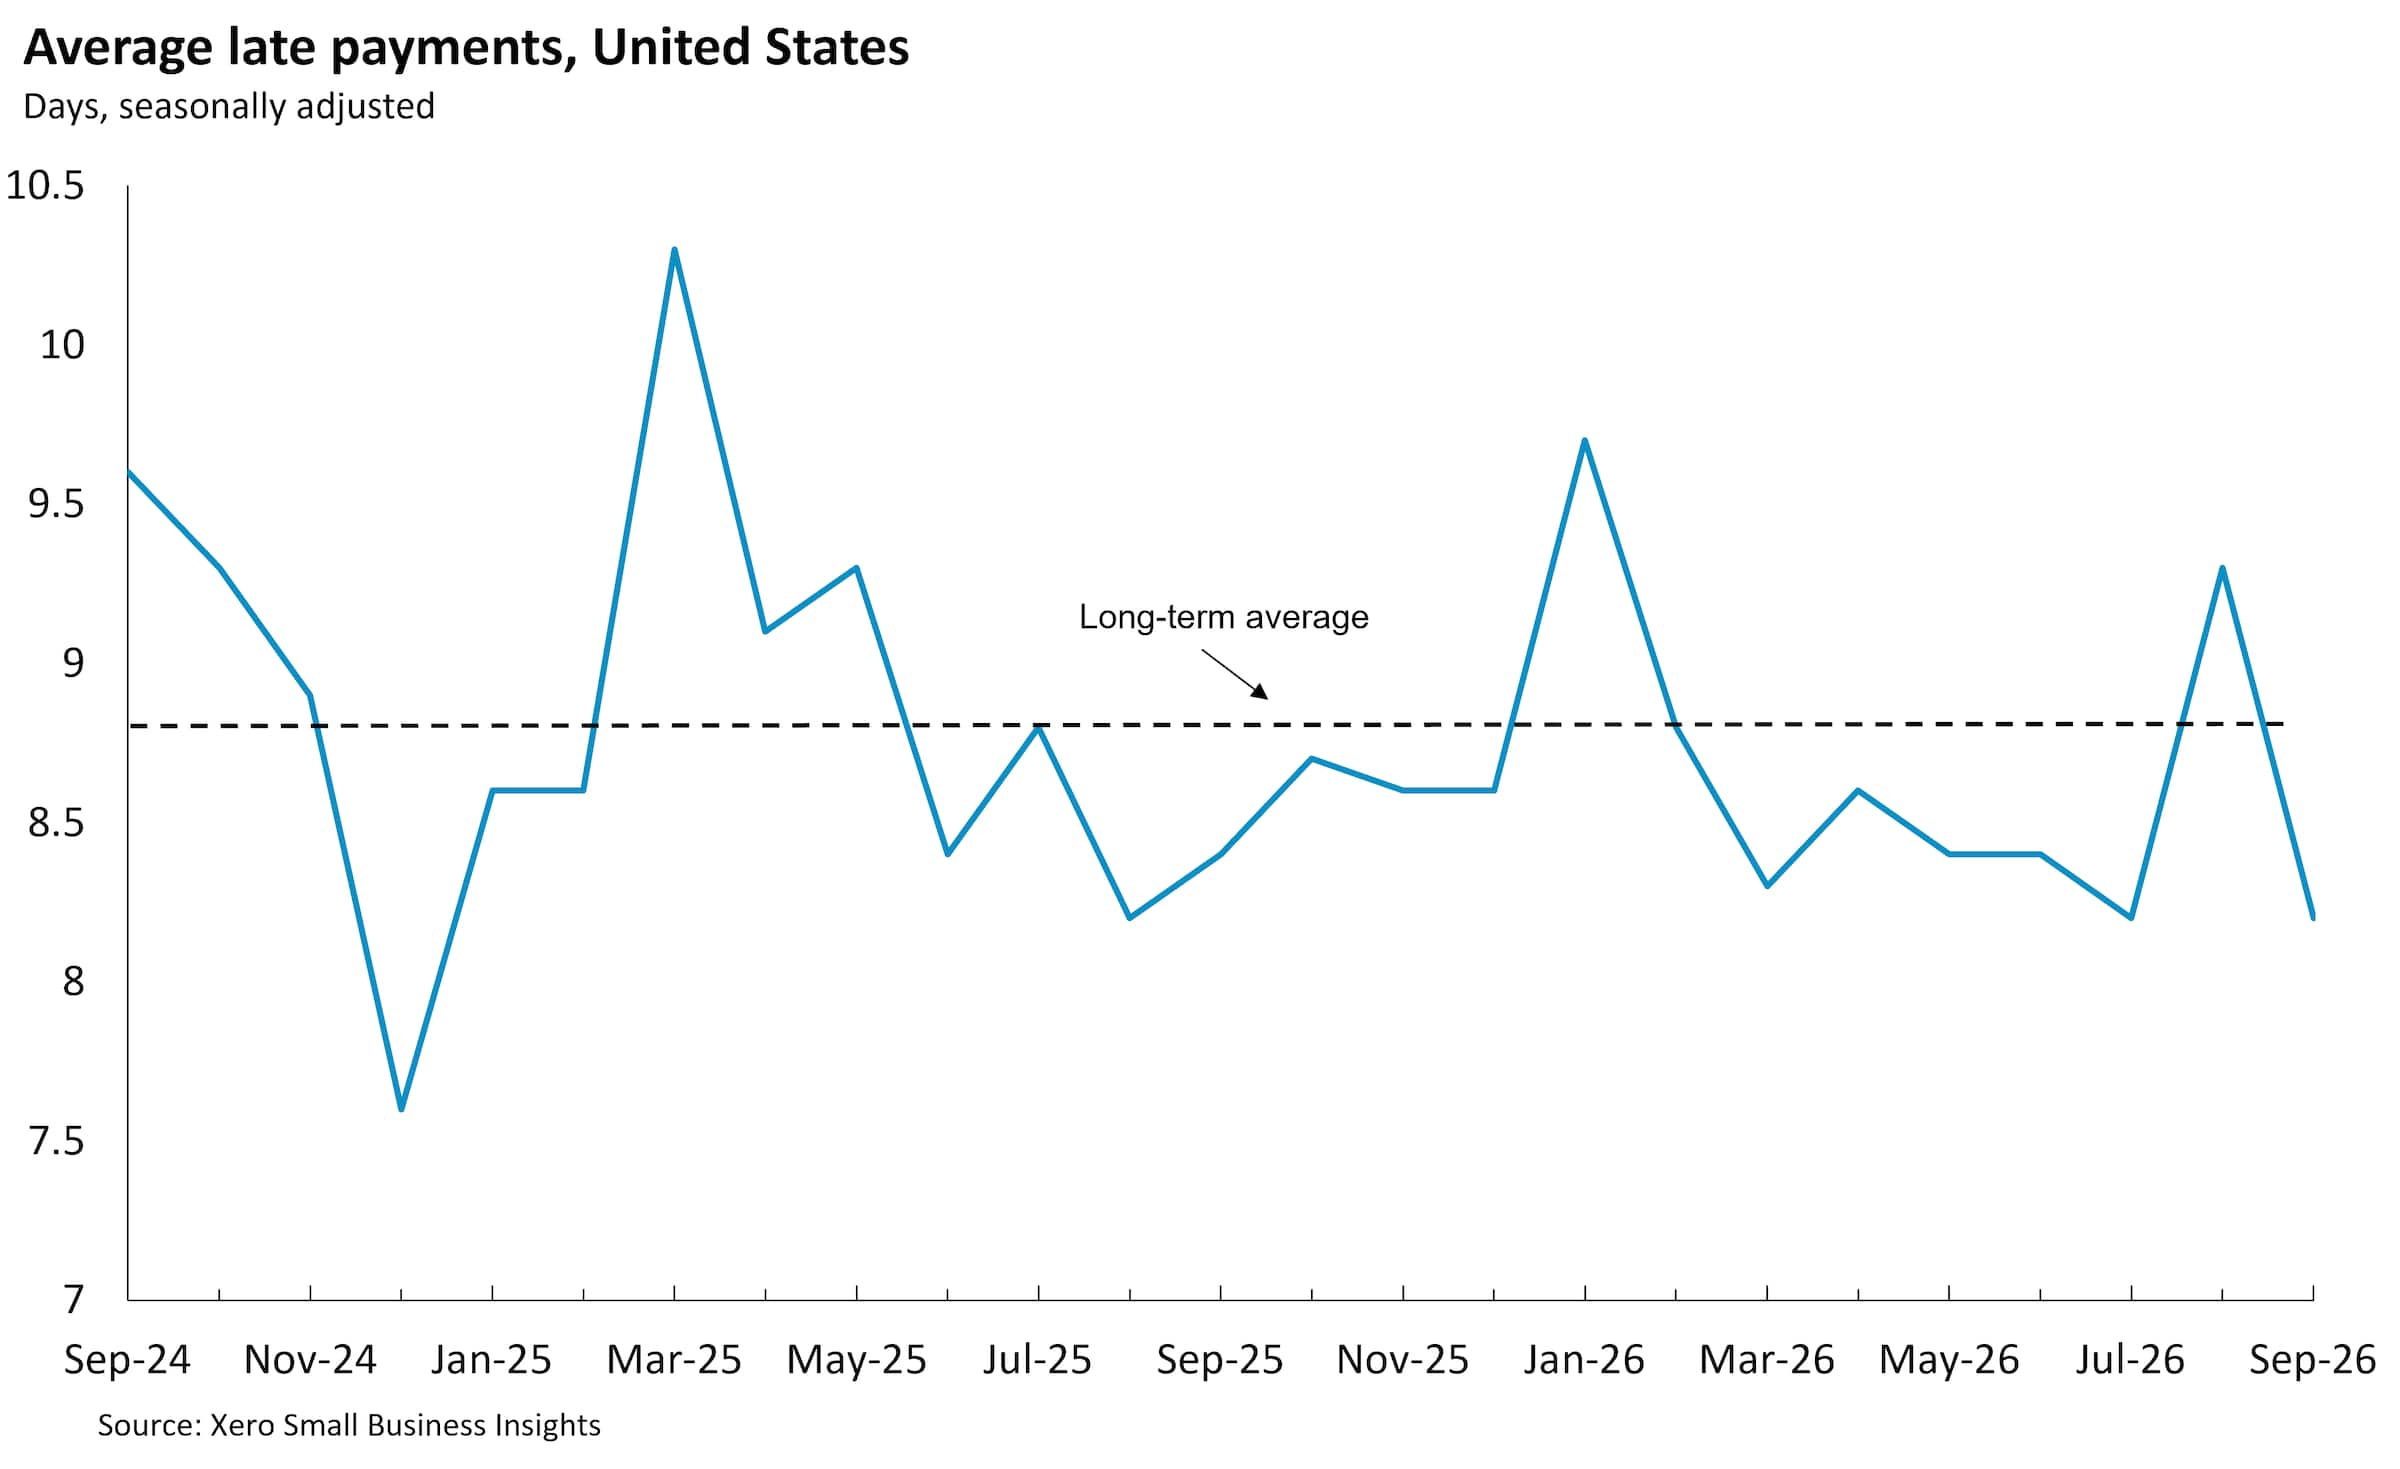
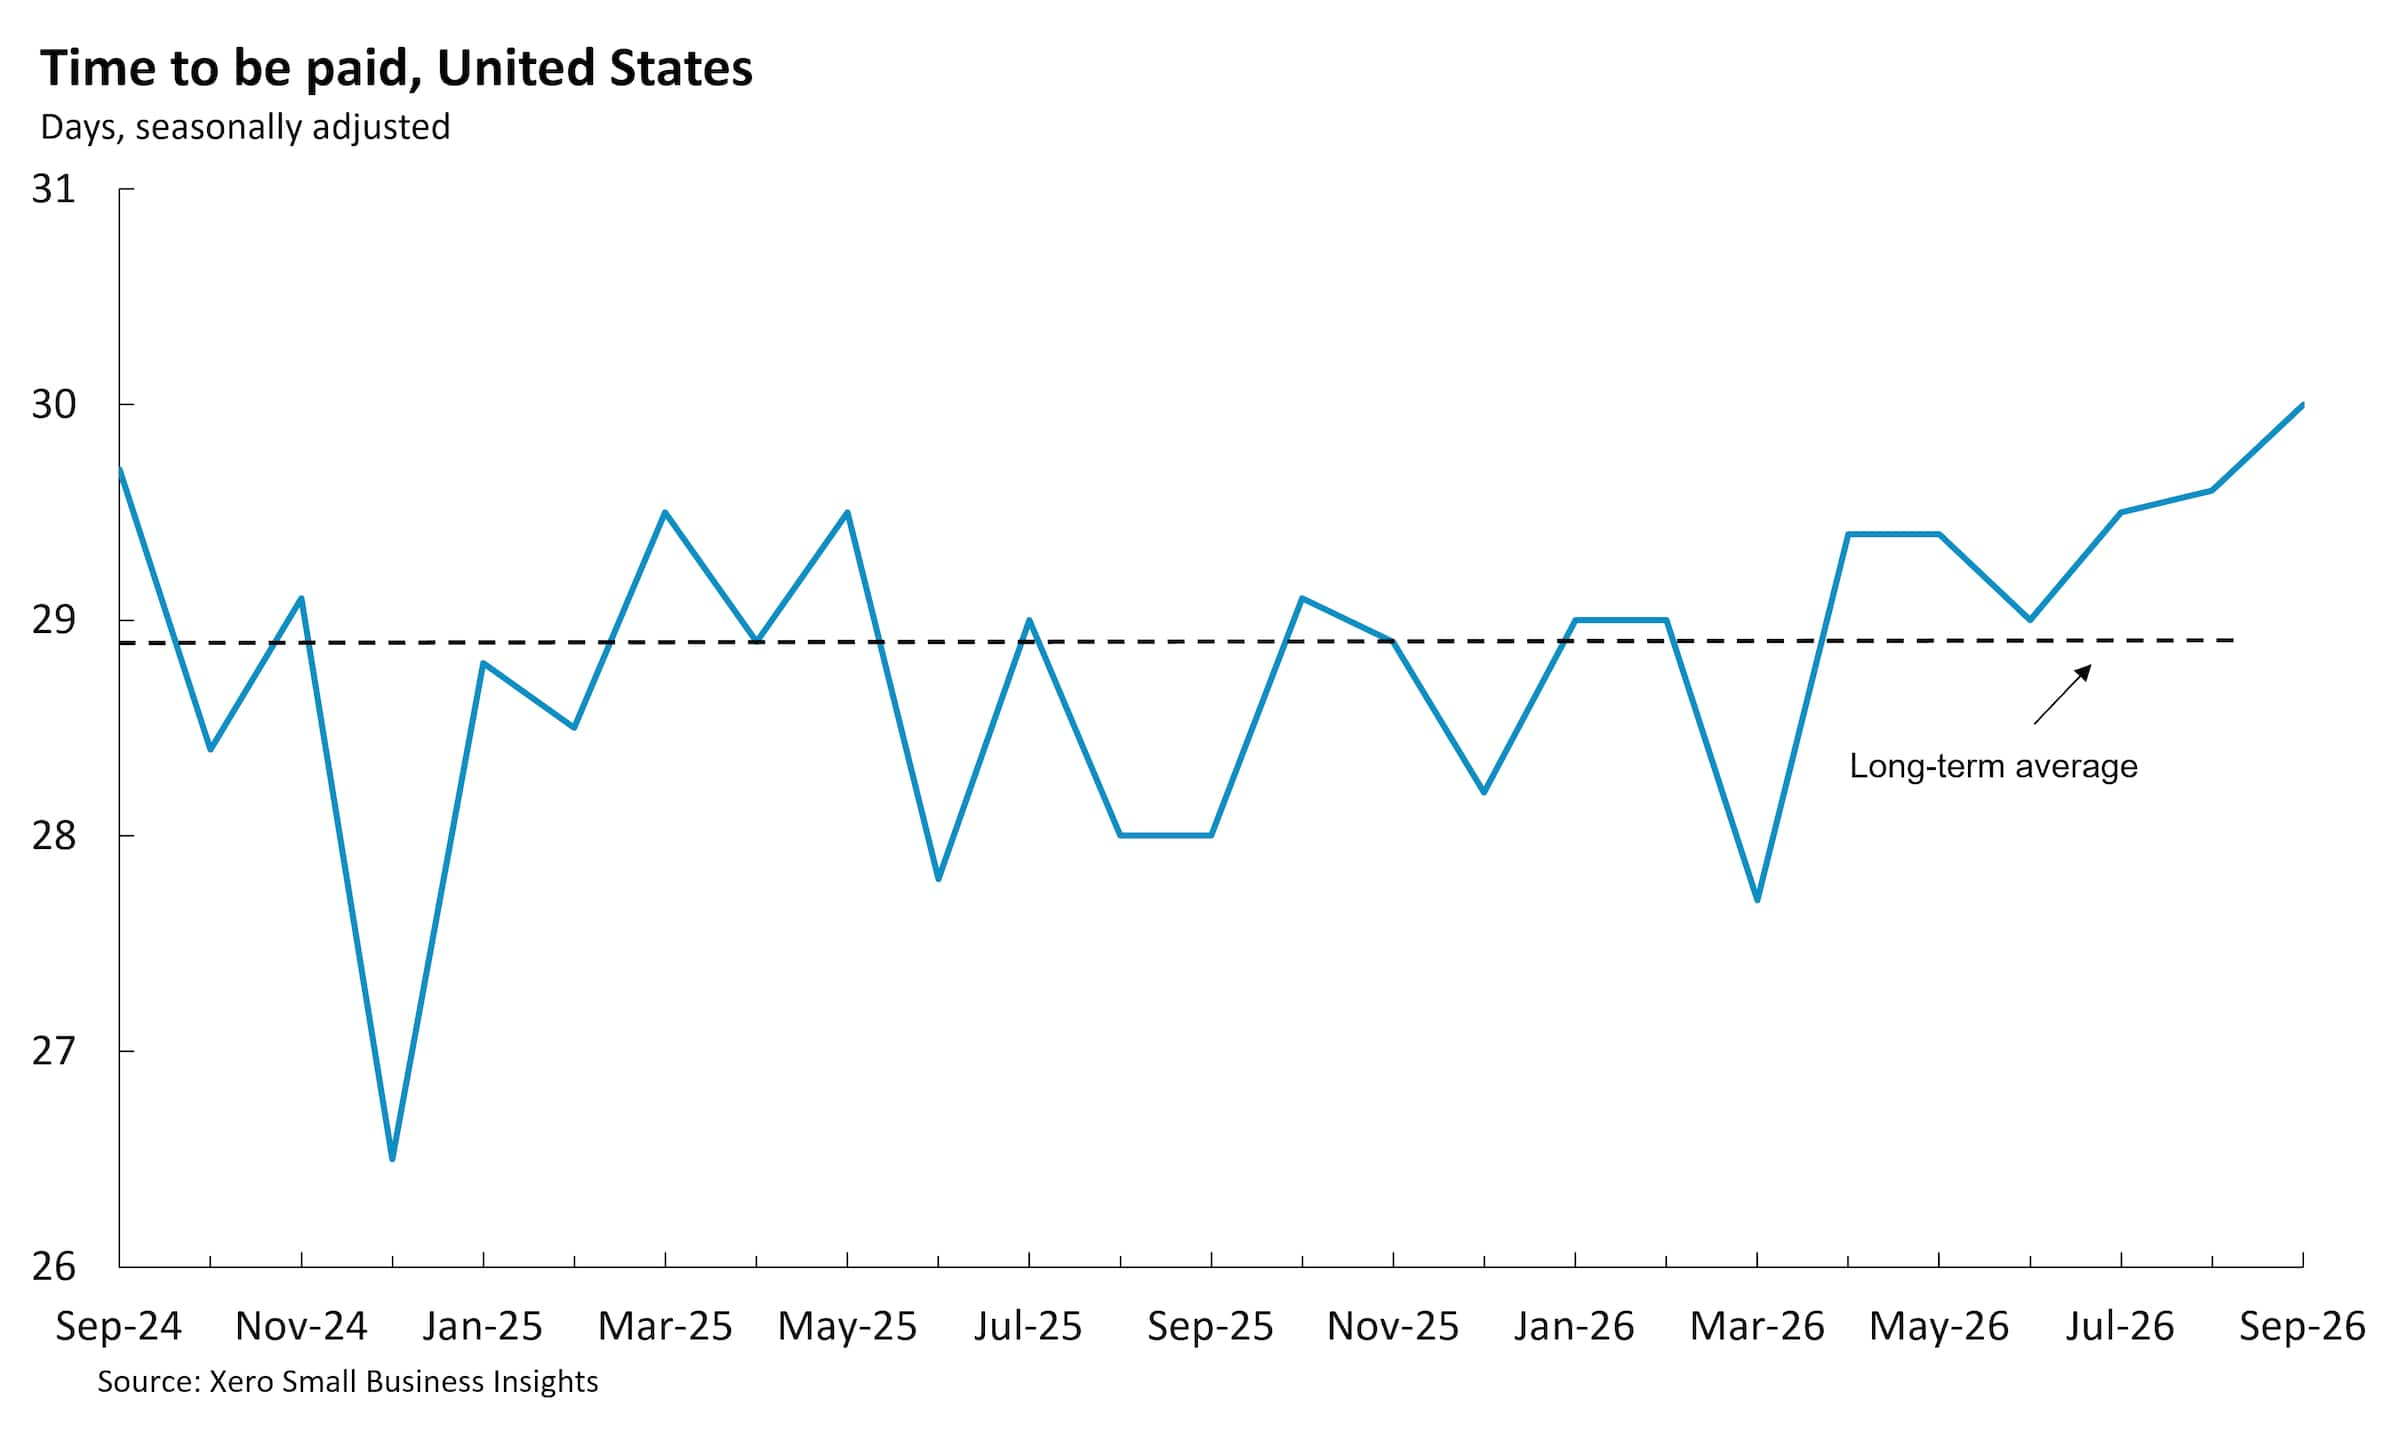
Small business payment times in the September quarter were similar to June quarter results. Small businesses waited an average of 29.7 days to be paid in the September quarter, only slightly longer than the June quarter (29.3 days) - although the month of June result (30 days) was the longest since March 2024. Small businesses were paid 8.6 days late in the September quarter, similar to the June quarter (8.5 days). The stability in these measures suggests that small business cash flows aren't coming under pressure yet, despite the slowdown in sales growth. However, debtors to US small businesses are still amongst the latest payers tracked by XSBI - second only to Canada.
Across the states, payment times ranged from 24.0 days in Florida and 25.6 days in California, up to 36.8 days in Texas and 36.5 days in Illinois.
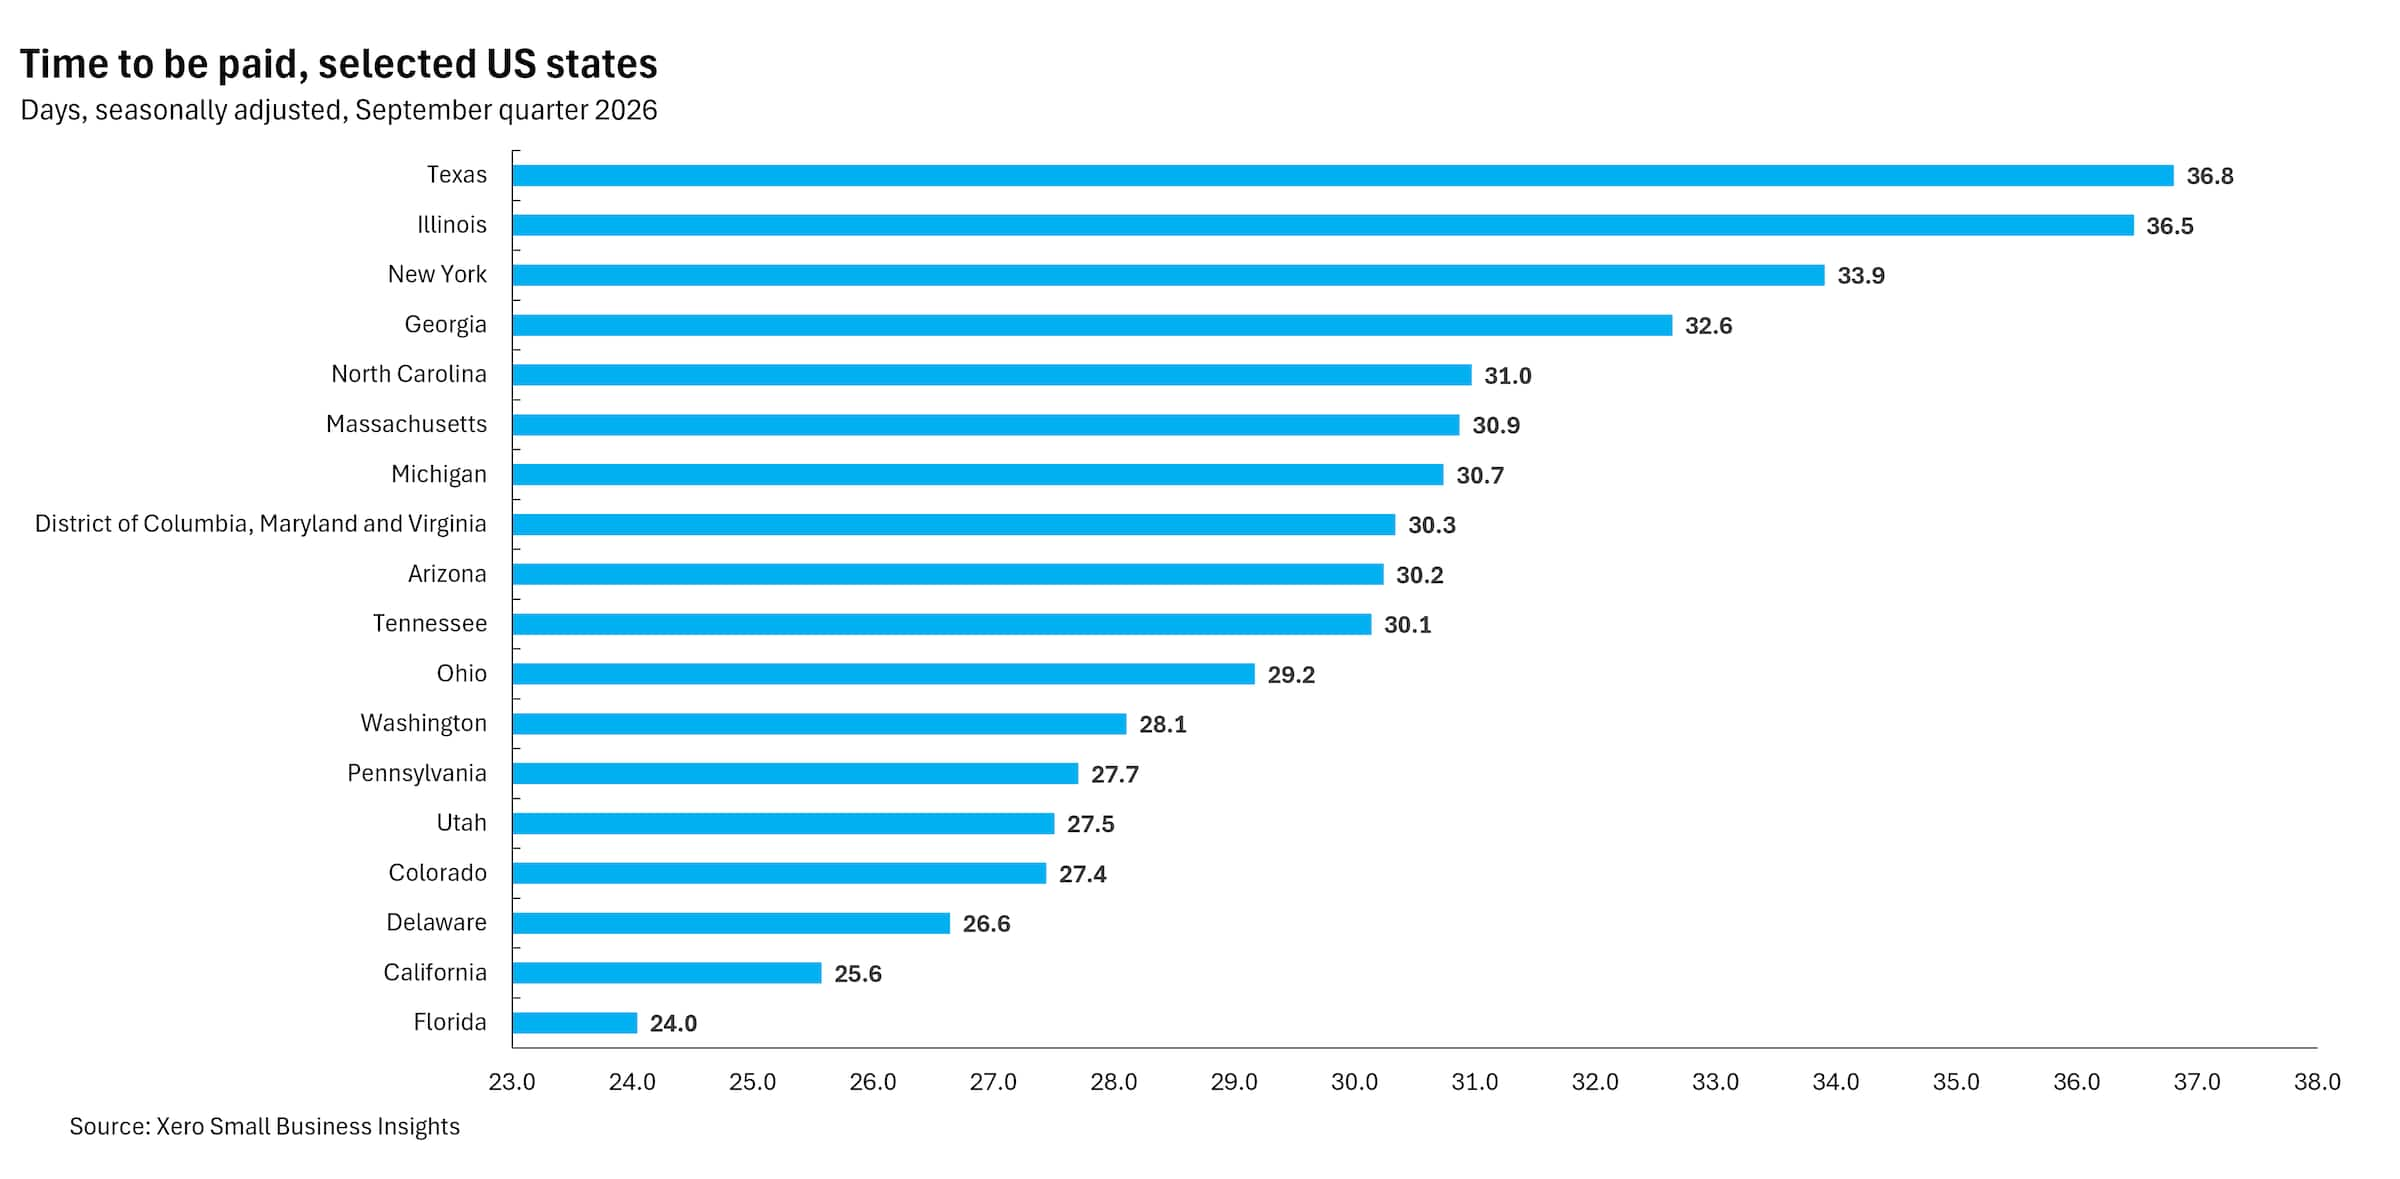
Overall, the XSBI data shows significant differences in both sales and payment time performances across the US. National results show a modest sales growth slowdown between the June and September quarters, with sales particularly soft in the month of September and back below the long-term average for the quarter. Looking at regional data, however, highlights that small businesses in some states are facing substantially more challenging conditions, while others are doing better than the national average.
Looking ahead, this latest data doesn't fully reflect the impact of the first increase in the Fed Funds rate this cycle in September or the upward pressure on market-determined long-term bond yields. Both of these play a role in determining loan interest rates in the US and will be having the effect of raising debt repayments for some households and businesses. This leaves less for households to spend in small businesses and squeezes profit margins.
The latest NFIB Small Business Economic Trends report showed a decline in optimism and a rise in uncertainty amongst small business owners. The Optimism Index declined 0.8 points in September to 97.9, around the 52-year average. A net 6% of respondents expect the economy to improve, down from 10% in the previous survey. Inflation pressures remain stubbornly high, with nearly a third reporting raising their selling prices in recent months. The Uncertainty Index rose 1 point to 90, remaining well above the historical average of 68, amid concerns about business expansion and investment.
The US economy, like many economies, is currently dominated by two opposing forces. On the one hand, business investment is being boosted by AI-related building of data centres and their associated fit outs. On the other hand, elevated gas prices, ongoing higher-than-normal inflation and rising interest rates are squeezing household budgets. Aside from some benefits flowing through to small businesses in the construction sector, for most small businesses the negative gas price and inflation impacts are likely to outweigh the benefits of data centre building activity.
For more information on the XSBI metrics, see our methodology page.

Disclaimer
This report was prepared using Xero Small Business Insights data and publicly available data for the purpose of informing and developing policies to support small businesses.
This report includes and is in parts based on assumptions or estimates. It contains general information only and should not be taken as taxation, financial, investment or legal advice. Xero recommends that readers always obtain specific and detailed professional advice about any business decision.
The insights in this report were created from the data that was available as at the date it was extracted. Data used was anonymised and aggregated to ensure individual businesses can not be identified.
Find out more about XSBI
If you have any questions about Xero Small Business Insights, reach out to us.