Liquidity ratios: types, formulas and how to use them
Learn how liquidity ratios show if you can pay bills on time and keep cash flowing.

Written by Jotika Teli—Certified Public Accountant with 24 years of experience. Read Jotika's full bio
Published Monday 23 February 2026
Table of contents
Key takeaways
- Calculate your current ratio (current assets divided by current liabilities) monthly to maintain a healthy range of 1.5 to 2.0, which ensures you have enough working capital to cover short-term expenses without financial strain.
- Use the quick ratio to assess your ability to pay bills within three months using only liquid assets, aiming for 1.0 or higher by excluding inventory and focusing on cash, securities, and accounts receivable.
- Speed up cash collection by sending invoices promptly, offering early payment discounts of 1-2%, and setting up automated payment reminders to improve your liquidity position.
- Monitor all three liquidity ratios together rather than relying on just one, as each provides different insights into your financial health and helps you make more informed decisions about spending and growth.
What are liquidity ratios?
Liquidity ratios measure the gap between your available cash and your upcoming bills. They help you assess whether your business can cover short-term expenses (typically 12 months or less) without selling long-term assets or taking on new debt.
Liquidity refers to how much cash your business has on hand, including assets you can quickly convert to cash. Cash flow issues are one of the biggest reasons new businesses fail. But it isn't always easy to tell if you have enough cash available. A company's liquidity can be uncorrelated with revenue stability.
Understanding your liquidity ratios helps you make confident decisions about operations, expenses, and investments. Without this insight, you risk spending too much, growing too fast, or leaving resources underused.
Three ratios are widely used in accounting:
- Current (working capital) ratio: the broadest measure, including inventory and all current assets
- Quick (acid test) ratio: a stricter measure that excludes inventory
- Cash ratio: the most conservative measure, using only cash and cash equivalents
With accounting software like Xero, you can check your quick ratio at any time. Here's what each ratio means and how to calculate it.
Why liquidity ratios matter
Liquidity ratios reveal whether your business can pay its bills on time. Without this visibility, you're making financial decisions in the dark.
Here's why tracking liquidity ratios helps your business:
- Cash flow confidence: know if you can cover payroll, rent, and supplier payments over the coming months
- Smarter spending decisions: understand when you can afford new equipment, staff, or inventory
- Loan readiness: lenders often require specific liquidity ratios before approving financing
- Early warning system: spot cash shortfalls before they become emergencies
- Growth planning: identify when you have excess cash that could be reinvested
Regularly checking your liquidity ratios helps you plan your finances without guesswork. You'll know exactly where you stand and can act accordingly.
Current (working capital) ratio
The current ratio is your current assets divided by your current liabilities. It shows whether you have enough working capital to cover your business's expenses over the next 12 months.
This ratio is also called the working capital ratio. It measures the buffer between what you own and what you owe in the short term.
Current ratio calculation
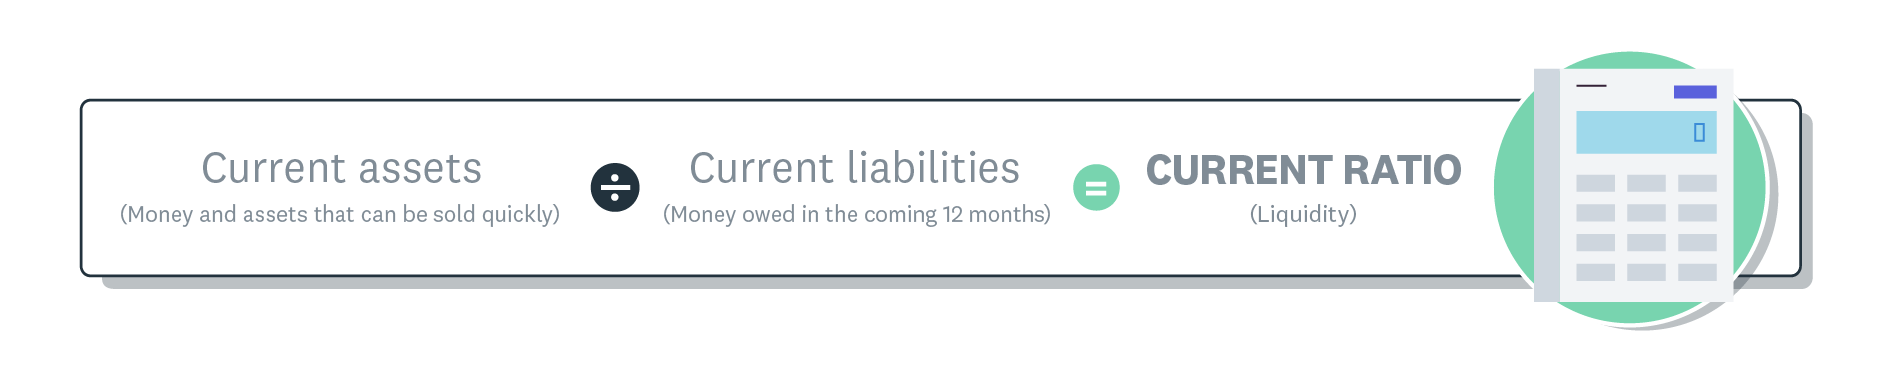
Current ratio liquidity formula
You can find the numbers for this calculation on your balance sheet. Look for total current assets near the top and total current liabilities near the middle. Ignore long-term assets and liabilities. You can use our free balance sheet template.
Here's what goes into the calculation.
What the current ratio includes
Unlike the quick ratio, the current ratio includes your inventory. The inventory value is based on what you paid for it, not what you'll sell it for.
If your inventory is worth less than you paid (such as out-of-season stock), adjust its value on the balance sheet for a more accurate ratio.
What counts as current liabilities
Current liabilities include all bills due within 12 months: accounts payable, payroll, sales tax, income tax, and short-term loans.
Your bookkeeping method affects what appears on your balance sheet. If you don't record monthly bills until they clear your bank account, they won't show up. An accountant or your bookkeeping software support team can help you set up your books correctly.
Current ratio example
Example calculation:
Imagine your balance sheet shows:
- Inventory: $25,000
- Bank account: $30,000
- Accounts receivable: $10,000
- Prepaid expenses: $5,000
- Short-term investments: $2,000
Total current assets: $72,000
Tip: Your balance sheet groups these together, so you can find the total labelled as "current assets."
Now find your current liabilities, which include accounts payable, payroll, sales tax, income tax payable, and short-term loans.
If your current liabilities are $100,000:$72,000 ÷ $100,000 = 0.72 (below the healthy range)
If your current liabilities are $72,000:$72,000 ÷ $72,000 = 1.0 (adequate, but little buffer)
The lower your liabilities relative to your assets, the higher your ratio and the stronger your position.
What's a good current ratio?
A good current ratio is often considered between 1.5 and 2.0 for most small businesses. However, analysts suggest a healthy range between 1.5 and 3.0 is more common. This depends on the industry. This means you have $1.50 to $2.00 in current assets for every $1.00 in current liabilities.
- Below 1.0: You may struggle to pay upcoming bills, though some businesses like retailers can operate well with ratios around 0.90 due to rapid inventory turnover.
- 1.0 to 1.5: Adequate, but leaves little room for unexpected expenses
- 1.5 to 2.0: Healthy buffer for most businesses
- Above 3.0: You may have excess cash or inventory that could be put to better use
If your ratio is too low, your expenses may be too high or you don't have enough cash on hand. A slow sales month could leave you unable to cover your bills.
When to use the current ratio
You can use the current ratio to make decisions about your expenses and cash on hand. For instance, if you have a low working capital ratio, you may need to cut expenses. A low ratio also indicates that if you're buying equipment, you probably shouldn't use your cash on hand. Consider a loan to spread the cost over time instead.
On the other hand, if your ratio is 3.0 or higher, you may be missing out on opportunities. You probably have cash, investments, or inventory lying around that should be reinvested into growing the company.
This ratio isn't the only number you need to consider. Don't rely on this ratio to assess your ability to cover your short-term bills if you run a seasonal business. This ratio only looks at your current assets and liabilities. It doesn't take into account the long-term profitability of your business, the types of loans you have, or other factors that contribute to your business.
Strengths of the current ratio:
- Requires only two numbers from your balance sheet
- Provides a quick snapshot of short-term cash flow health
- Helps assess your ability to cover upcoming expenses
- Signals when you may need financing
- Indicates when you have resources available for growth
Limitations of the current ratio:
- Changes significantly when either number shifts
- Hides seasonal cash flow patterns
- Covers only short-term health (12 months or less)
- Ignores long-term financial challenges
- Excludes insights about profitability or debt structure
Quick (acid test) ratio
The quick ratio measures your company's ability to cover expenses over the next three months without selling inventory or taking out loans. It's also called the acid test ratio.
Unlike the current ratio, the quick ratio excludes inventory because inventory can't always be converted to cash quickly. This gives you a stricter view of your short-term financial position.
The question it answers: Can your cash, securities, and accounts receivable cover your payroll, bills, and loan payments over the next three months?
Quick ratio calculation
There are two ways to calculate the quick ratio. Both should give you the same result.
Method 1: Add liquid assets
-calculation-1.1708626946524.png)
Quick ratio liquidity formula Version 1
(Cash + Securities + Accounts receivable) ÷ Current liabilities = Quick ratio
Add your cash, securities (shares, bonds, and other assets you can quickly convert to cash), and accounts receivable (money owed to you). Divide by what you owe in the next three months.
Method 2: Subtract from current assets
-calculation-2.1708626946541.png)
Quick ratio liquidity formula Version 2
(Current assets − Inventory − Prepaid expenses) ÷ Current liabilities = Quick ratio
Start with total current assets from your balance sheet. Subtract inventory and prepaid expenses. Divide by current liabilities.
Quick ratio example
Example calculation:
- Cash in bank: $30,000
- Securities: $15,000
- Current liabilities (next 3 months): $60,000
Quick ratio: ($30,000 + $15,000) ÷ $60,000 = 0.75
A ratio of 0.75 means you have 75 cents in liquid assets for every $1 of upcoming expenses. This is below the ideal 1.0 threshold, suggesting you may need to improve cash collection or reduce short-term obligations.
The quick ratio is also called the acid test ratio because, like a quick acid test, it gives you a fast, definitive answer. Your balance sheet should have all the numbers you need.
What's a good quick ratio?
A good quick ratio is 1.0 or higher, with the sweet spot for many businesses falling between 1.0 and 1.5, depending on the industry. This means you have at least $1 in liquid assets for every $1 of upcoming expenses.
- Below 0.5: Significant risk of not meeting short-term obligations
- 0.5 to 1.0: May struggle to cover bills if cash flow slows
- 1.0: Adequate liquidity for most situations
- Above 1.5: Strong position with buffer for unexpected costs
A ratio of 0.3 means you have only 30 cents available for every $1 in bills over the next three months.
When to use the quick ratio
Use this ratio to compare different companies if you're thinking about investing in a new company. You can also use it to compare your business's financial health to other companies in your industry, or to look at your business's liquidity over different periods.
You can use this ratio as a quick guide when you're thinking about taking on new expenses. But don't use it to assess the long-term health of your company.
For instance, you might be sitting on a stack of cash because you've had a great launch. But if your product or service doesn't have staying power, you won't be able to maintain your cash flow. The quick ratio isn't going to show you that.
The quick ratio:
- Is easy to calculate
- Gives you a good idea of whether you can cover your expenses over the short term
- Helps you compare differences in cash flow between periods, so you can plan ahead for shortages
- Lets you see liquidity to determine if you can afford more expenses or investments
But:
- The quick ratio doesn't take operating income into account
- It only considers a short-term (three-month) period
- It's tricky to estimate whether you have lots of marketable securities during times of economic stability. The same applies if you have lots of volatile stocks that change value quickly.
- The quick ratio may be inaccurate if you overstate the value of your accounts receivables. Be realistic about the percentage of these bills that won't get paid.
Cash ratio
The cash ratio is your cash and cash equivalents divided by your current liabilities. It's the most conservative liquidity measure because it only counts assets you can access immediately.
This ratio tells you whether your actual cash on hand can cover payroll, expenses, and loan payments over the next year. It excludes accounts receivable and inventory entirely.
Because it uses the fewest assets, the cash ratio is the fastest to calculate and gives the strictest view of your liquidity.
Cash ratio calculation
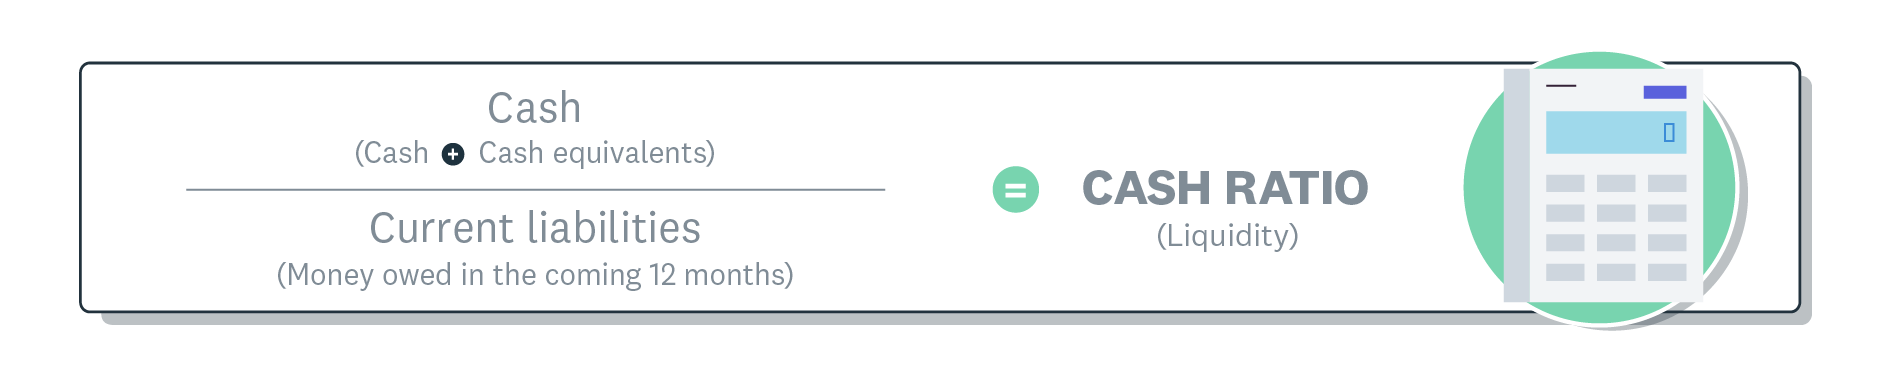
Cash ratio liquidity formula
The cash ratio calculation only includes the cash in your bank accounts and any securities your business can cash out quickly. It doesn't consider:
- inventory or accounts receivables (money people owe your business)
- any revenue you're likely to receive
Cash ratio example
Example calculation:
- Cash: $50,000
- Stocks (cash equivalents): $50,000
- Total: $100,000
Find your current liabilities on your balance sheet. This includes loan payments, monthly bills, taxes due, and payroll.
Scenario 1: Current liabilities of $250,000
$100,000 ÷ $250,000 = 0.4
A ratio of 0.4 means you have only 40 cents in cash for every $1 of bills. You may need to speed up receivables collection or reduce expenses.
Scenario 2: Current liabilities of $25,000
$100,000 ÷ $25,000 = 4.0
A ratio of 4.0 indicates a very strong cash position. Consider whether some of that cash could be invested in growth opportunities.
What's a good cash ratio?
A good cash ratio depends on your industry; for example, one analysis found that among similarly rated companies, the Pharmaceuticals industry had the highest median liquidity ratio (21.3%), while the Media industry had the lowest (1.2%).
- Below 0.2: You may struggle to cover immediate obligations
- 0.2 to 0.5: Adequate for most businesses with reliable receivables
- Above 0.5: Strong cash position, though excess cash could be earning returns elsewhere
A high ratio indicates your business can easily cover expenses. A low ratio suggests you may have trouble paying bills and might need to collect receivables faster.
When to use the cash ratio
The cash ratio doesn't reflect every situation your business is facing. If you've just invested lots of cash into a new product line, your cash ratio may be low. But that doesn't necessarily mean your business will suffer. It simply means you've decided to reduce your cash on hand to earn more revenue with your new product.
When you're making decisions about expenses, liquidity ratios can help you judge when you're going too low with your cash on hand.
The cash ratio:
- Is easy to calculate
- Provides quick insights on a business's cash utilisation rates
- Shows a realistic ability to cover short-term expenses because it only takes into account cash and cash equivalents, not inventory or other assets
But:
- The cash ratio doesn't include any operating income
- It doesn't take into account how long-term credit with suppliers or accounts receivables cycles affect cash on hand
- It doesn't take into account long-term expenses or challenges
Days sales outstanding
Days sales outstanding (DSO) measures the average number of days it takes to collect payment after a sale. While not a liquidity ratio, DSO directly affects your cash flow and liquidity position.
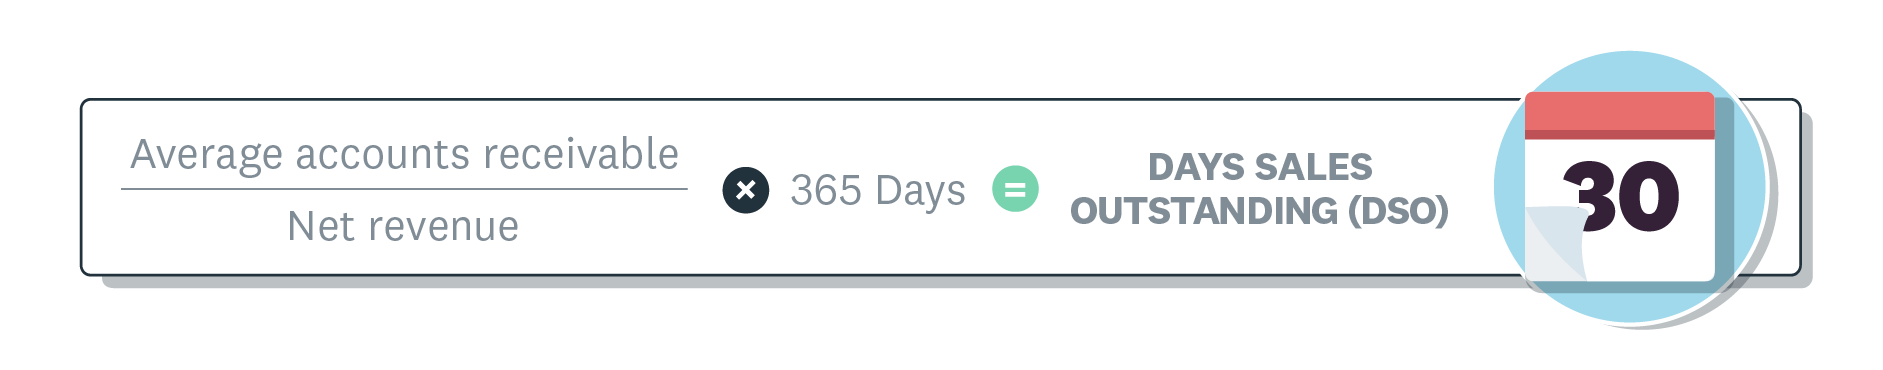
The days sales outstanding formula
Formula: Average accounts receivable ÷ Revenue per day = DSO
A high DSO means customers are taking longer to pay, which ties up your cash. If your DSO is climbing, consider:
- sending invoices promptly
- offering early payment discounts
- following up on overdue accounts
- reviewing credit terms for new customers
Typical benchmarks: DSO varies by industry, but 30 to 45 days is common for small businesses. Above 60 days often signals collection problems.
How to use liquidity ratios
Use liquidity ratios consistently and in context to make informed financial decisions. Here's how to get the most value from them.
Track ratios monthly
Calculate your ratios at the same time each month. Ratios can shift based on where you are in your billing cycle, so consistency matters.
Watch the trend, not just the number
A single ratio is a snapshot. Look at how your ratios change over time to spot patterns and catch problems early.
Know each ratio's limitations
No single ratio tells the whole story. Each has strengths and blind spots. Use them together for a fuller picture.
Combine with other financial metrics
Analyse liquidity ratios alongside solvency ratios (debt-to-equity) and efficiency ratios (inventory turnover) for a complete view of business health.
Work with a professional
Consider consulting an accountant or financial advisor, especially when making major decisions. The stakes are high, and expert guidance can help.
How to improve liquidity
If your liquidity ratios are lower than you'd like, take these steps to improve them:
Speed up cash coming in:
- Send invoices promptly: Use accounting software like Xero to automate invoicing and payment collection
- Offer early payment incentives: Discounts of 1–2% can motivate faster payment
- Automate payment reminders: Set up automatic follow-ups so overdue invoices don't slip through
Slow down cash going out:
- Negotiate supplier terms: Request extended payment windows where possible
- Review recurring expenses: Cut non-essential spending and find more cost-effective suppliers
- Pay on time, not early: Avoid late fees, but don't pay before you need to
Optimise your assets:
- Reduce excess inventory: Use just-in-time ordering to free up cash
- Sell unproductive assets: Convert idle equipment or stock into working capital
- Lease instead of buying: Preserve cash reserves by renting equipment when appropriate
Grow strategically:
- Increase sales efficiently: Expand your customer base or add products without proportionally increasing costs
- Consider refinancing: Consolidate expensive short-term debt into lower-interest loans
Your accountant can help you decide which strategies fit your situation. Find experienced accountants and bookkeepers in the Xero advisor directory.
Manage your liquidity with confidence
Understanding your liquidity ratios gives you the clarity to make confident financial decisions. Whether you're assessing your ability to cover upcoming bills, planning for growth, or preparing for a loan application, these ratios provide the insight you need.
Consistency matters most. Track your ratios monthly. Watch for trends. Take action when numbers move in the wrong direction. With the right tools, monitoring your liquidity takes minutes, not hours.
With Xero's real-time financial reporting, you can check your current ratio, track accounts receivable, and monitor cash flow at a glance. No manual calculations needed.
Get one month free and see how Xero helps you manage your finances.
FAQs on liquidity ratios
Here are answers to common questions about liquidity ratios.
What are the main liquidity ratios for small businesses?
The three main liquidity ratios are the current ratio (current assets ÷ current liabilities), quick ratio (liquid assets ÷ current liabilities), and cash ratio (cash ÷ current liabilities). Each measures short-term financial health with increasing strictness.
What is a healthy liquidity ratio?
A healthy current ratio is typically between 1.5 and 2.0, meaning you have $1.50 to $2.00 in assets for every $1.00 in liabilities. For the quick ratio, aim for 1.0 or higher.
What does a liquidity ratio of 2.5 mean?
A liquidity ratio of 2.5 means you have $2.50 in assets for every $1.00 of short-term liabilities. This is generally a strong position, though a very high ratio may indicate excess cash that could be invested in growth.
How often should I calculate my liquidity ratios?
Calculate your liquidity ratios monthly, ideally at the same point in your billing cycle each time. This consistency helps you spot trends and catch potential cash flow problems early.
Can my liquidity ratio be too high?
Yes. A very high liquidity ratio (above 3.0 for the current ratio) may indicate you're holding too much cash or inventory that could be earning returns elsewhere. Consider whether excess funds could be reinvested in growth, debt reduction, or higher-yield opportunities.
Disclaimer
Xero does not provide accounting, tax, business or legal advice. This guide has been provided for information purposes only. You should consult your own professional advisors for advice directly relating to your business or before taking action in relation to any of the content provided.
Start using Xero for free
Access Xero features for 30 days, then decide which plan best suits your business.