Chart of accounts
Learn what a chart of accounts is, the five account types, and how to set one up for your Irish small business.
Published Wednesday 30 September 2026
Table of contents
Key takeaways
- A chart of accounts lists every account you use to record transactions, so each euro you earn or spend has a clear home
- Every account belongs to one of five types: assets, liabilities, equity, revenue or expenses
- Clear names, codes with gaps and a yearly review keep your chart easy to use as your business grows
- Well-organised accounts make it easier to keep the records Revenue expects and to produce accurate reports
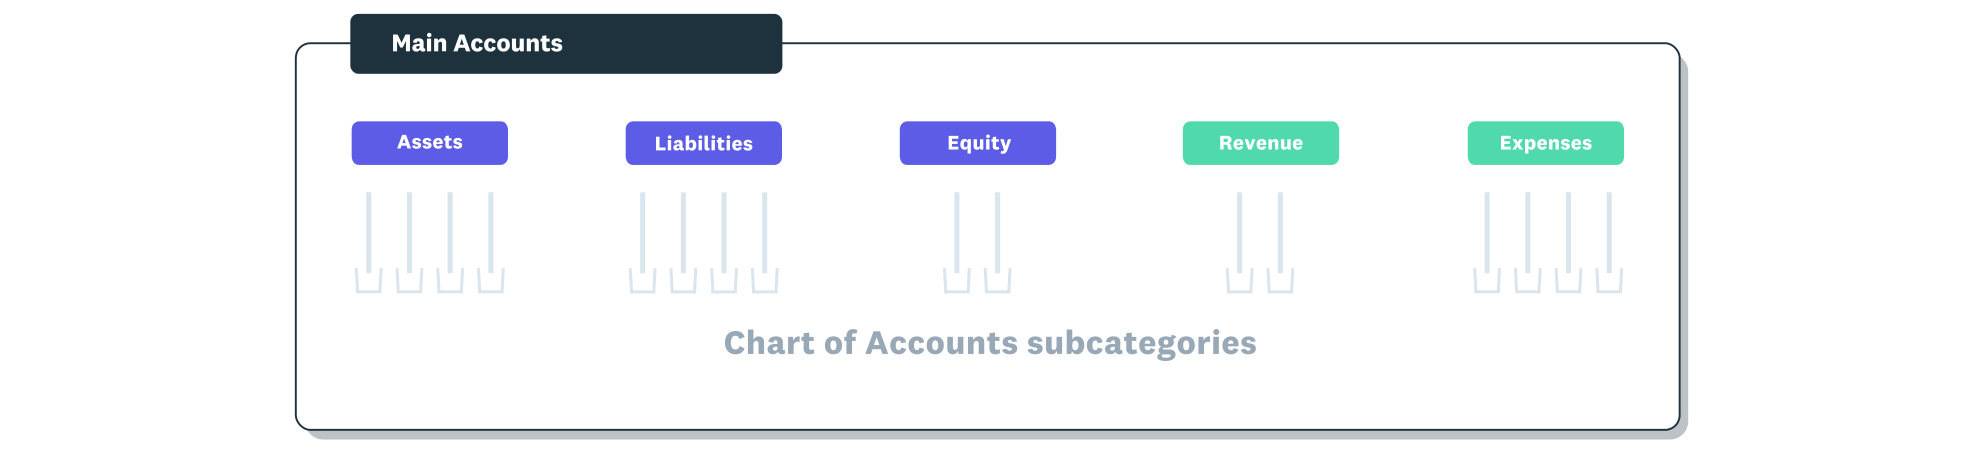
The chart of accounts is organised under the five main account types.
Chart of accounts definition
A chart of accounts is a list of all the accounts you use to record financial transactions in your general ledger. It helps you track where your money comes from and where it goes.
Think of it like a map. It categorises your transactions correctly and groups similar accounts together, so your bookkeeping, accounting and financial reporting stay accurate.
Say you run a café in Galway. When you pay your milk supplier, your chart of accounts tells you that cost belongs in cost of sales, right beside your other ingredient costs.
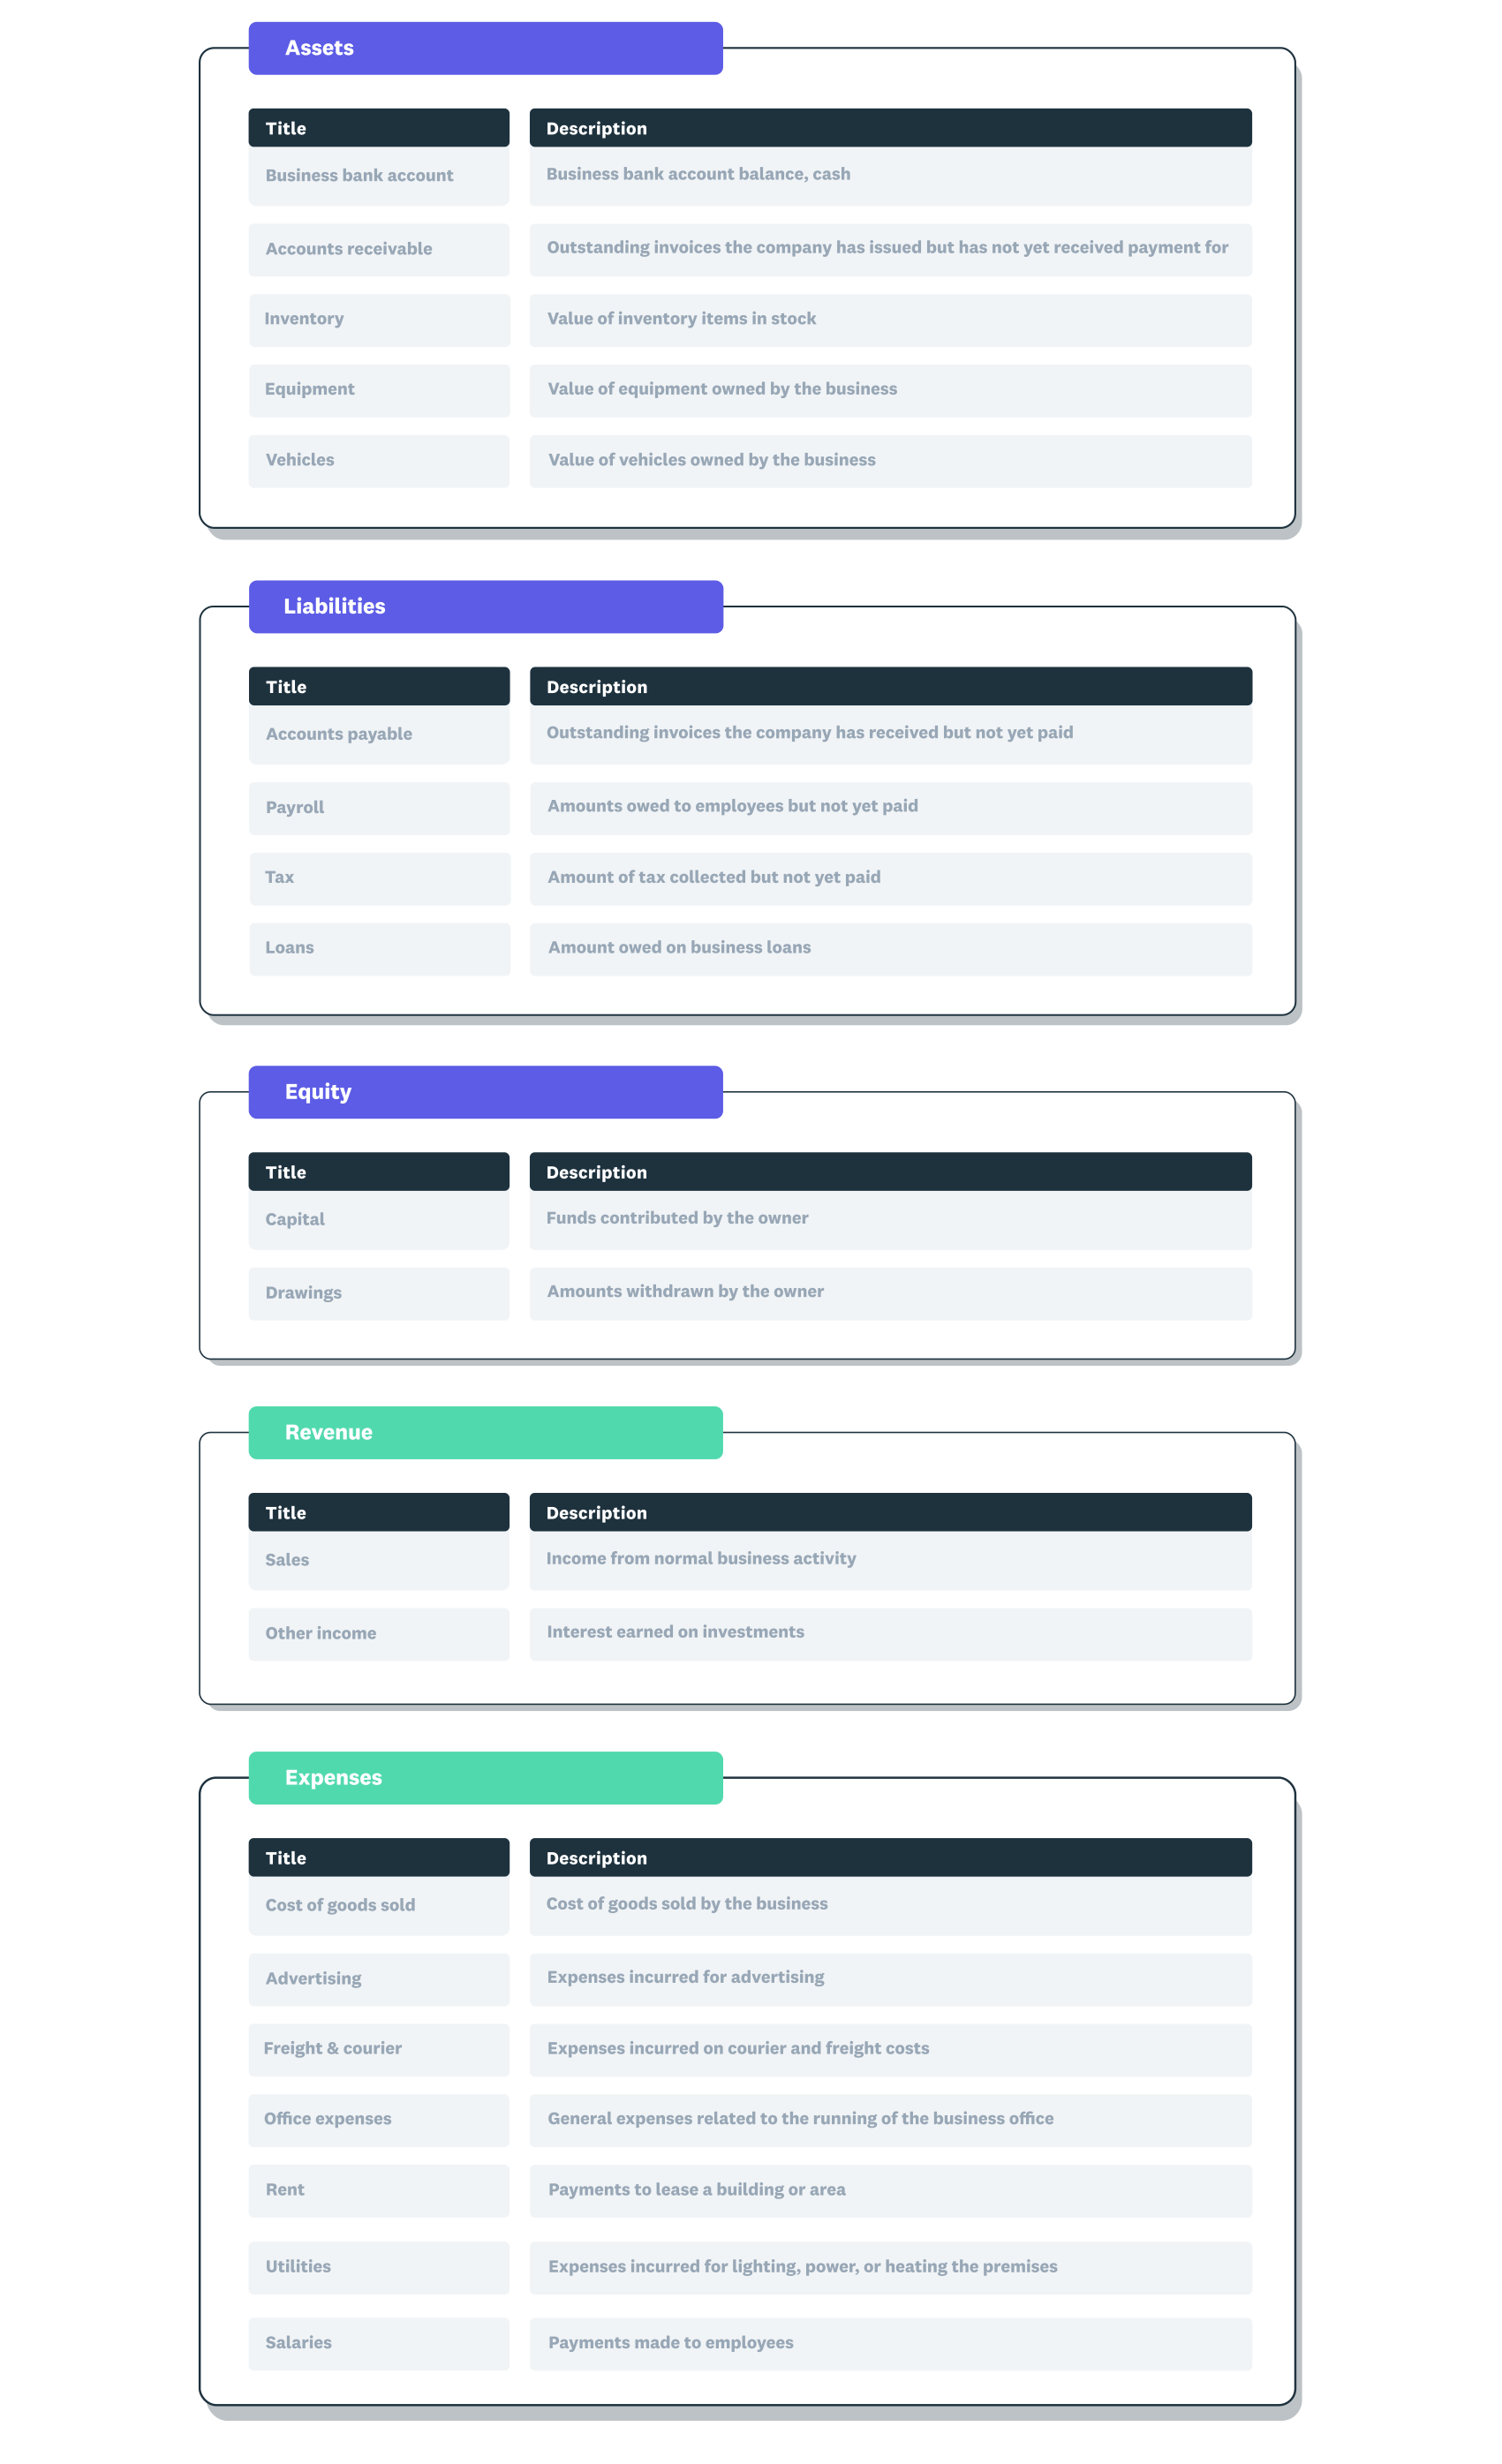
A chart of accounts example showing the five main account types with subcategories within each.
The 5 types of accounts in a chart of accounts
Every account you create belongs to one of five types. Each type tells you something different about your business’s finances.
- Assets are things your business owns, such as your bank account, debtors, stock and equipment
- Liabilities are debts your business owes, such as creditors, bank loans, credit cards and VAT owed to Revenue
- Equity is the owners’ stake, including money they put in and drawings they take out
- Revenue, or income, is the money your business earns, such as product sales and service fees
- Expenses are the money your business pays out to operate, such as rent, wages, utilities and insurance
Assets, liabilities and equity show what your business owns and owes at a point in time. Revenue and expenses show how it performed over a period, such as a month or a year.
How a chart of accounts works with your general ledger
Your chart of accounts lists the accounts, and your general ledger holds the transactions posted to them. Each time you record a transaction, it goes to at least two accounts from your chart.
This method is called double-entry bookkeeping. Every entry has a debit to one account and an equal credit to another, so your books stay in balance.
For example, when a customer pays for a catering order by card, your bank account goes up. Your catering sales account goes up by the same amount.
At the end of a period, the balance of each account feeds into a trial balance. This report checks that your total debits equal your total credits.
Those balances then flow into your financial statements. Asset, liability and equity accounts make up your balance sheet, which shows your financial position on a given date.
How a chart of accounts is organised
A chart of accounts usually lists balance sheet accounts first, then the accounts that track performance. Assets, liabilities and equity come first, followed by revenue and expenses, which make up your profit and loss statement.
Each account gets a name, a short description and a code. Many businesses group codes in ranges like these, although it’s a common convention and your accountant may suggest another system.
- 1000s for assets
- 2000s for liabilities
- 3000s for equity
- 4000s for revenue
- 5000s for expenses
Leave gaps between codes so you can add new accounts in the right place later. If your bank current account is 1000 and debtors is 1100, you can add a savings account at 1010 without renumbering anything.
Sub-accounts sit under a main account when you want more detail. A café might split sales into food sales and coffee sales, while still seeing total sales in its reports.
How to set up a chart of accounts
You can set up a chart of accounts in a few steps, and you’ll rarely need to start from a blank page. Work through these steps in order.
- Start with the five types of accounts: assets, liabilities, equity, revenue and expenses
- Use your accounting software’s default chart as a base, then adjust it to suit your business
- Add sub-accounts only where you need more detail, such as splitting sales by product
- Give each account a clear name, a short description and a code, leaving gaps between codes
- Check the chart with your accountant, including the accounts you’ll need for cash or accrual accounting
- Review it at least once a year and archive accounts you’ve stopped using
Keep it simple at the start. It’s easier to add an account when you need one than to merge several later.
Example of chart of accounts categories
Here’s a chart of accounts example for a small café in Ireland. The codes are illustrative, so your own chart may use different numbers and names.
- 1000 Bank current account
- 1100 Debtors
- 2000 Creditors
- 2100 VAT owed to Revenue
- 3000 Owner’s capital
- 4000 Food sales
- 4100 Coffee sales
- 5000 Cost of sales
- 5100 Wages
- 5200 Rent
With accounts like these, the café owner can compare coffee sales with food sales at a glance. They can also see how wages and rent track against income each month.
As the café grows, the owner can slot in new accounts using the gaps. A new catering service could sit at 4200, with packaging costs at 5010 beside cost of sales.
Common chart of accounts mistakes to avoid
These common mistakes make your reports harder to read and your records harder to check. Watch out for these.
- Creating too many accounts, which spreads small amounts across lines you rarely look at
- Using vague names like “Miscellaneous” or “Other”, which hide what you actually spent
- Mixing account types, such as recording a loan repayment as an expense
- Numbering accounts with no gaps, which leaves no room for new ones
- Leaving the chart unreviewed for years, so unused accounts pile up
If you spot a miscoded transaction, you or your accountant can move it to the right account with a journal entry. Regular bank reconciliation helps you catch these errors early, because you match each transaction against your bank statement.
Why a chart of accounts matters for your business
A chart of accounts keeps your records organised, which makes your reports clearer and your record-keeping simpler. When every cost sits in the right account, you can see which areas are growing and where you could save.
It also helps you meet your record-keeping duties in Ireland. Revenue requires anyone running a business to keep records for tax purposes and to hold on to original documents for six years.
Companies have an extra duty. Under the Companies Act 2014, a company must keep its accounting records for at least six years after the end of the financial year they relate to.
A clear chart makes those records easier to find when you file VAT returns or share figures with your accountant. It also helps a lender or investor understand your accounts quickly when you apply for funding.
Simplify your chart of accounts with Xero
A well-planned chart gives you accurate books and reports you can act on. Xero brings your accounts, transactions and reports together in one place, so you spend less time on admin.
You can set up and customise your chart of accounts to suit your business. Bank feeds bring in your transactions, so you can categorise them and see your reports in real time.
Get started today and get one month free.
FAQs on chart of accounts
Here are answers to common questions about building and maintaining your accounts list.
How many accounts should a chart of accounts have?
There’s no set number, because it depends on how complex your business is and how much detail you want in your reports. Add a new account only when it will change how you read your figures.
What’s the difference between a chart of accounts and a general ledger?
The chart of accounts is the list of account names and codes. The general ledger is the full record of every transaction posted to those accounts.
How often should you update your chart of accounts?
Review it at least once a year, ideally before your financial year ends. Update it sooner when your business changes, such as when you register for VAT or hire your first employee.
Is there a standard chart of accounts format in Ireland?
There’s no single mandatory format for small businesses in Ireland, but most charts group accounts into the same five types. Your accountant can align your chart with the layout of your financial statements.
Is a chart of accounts required?
The law doesn’t require a chart of accounts itself, but you must keep proper records of your business income and expenses. A chart of accounts is a practical way to keep those records organised and easy to check.
Related terms
Learn more about chart of accounts
Handy resources
Advisor directory
You can search for experts in our advisor directory
Xero Small Business Guides
Discover resources to help you do better business
Online accounting with Xero
Automate your accounting in the cloud
Disclaimer
This glossary is for small business owners. The definitions are written with their requirements in mind. More detailed definitions can be found in accounting textbooks or from an accounting professional. Xero does not provide accounting, tax, business or legal advice.