Chart of accounts
A chart of accounts lists every account your business uses to record and organise financial transactions.
Published Wednesday 12 August 2026
Table of contents
Key takeaways
- A chart of accounts is an organised list of every account your business uses to record financial transactions in your general ledger.
- The five main account types are assets, liabilities, equity, revenue and expenses.
- Your chart of accounts forms the foundation of your financial reports, including your balance sheet and income statement.
- Accounting software like Xero sets up a chart of accounts for you automatically, saving time and reducing errors.
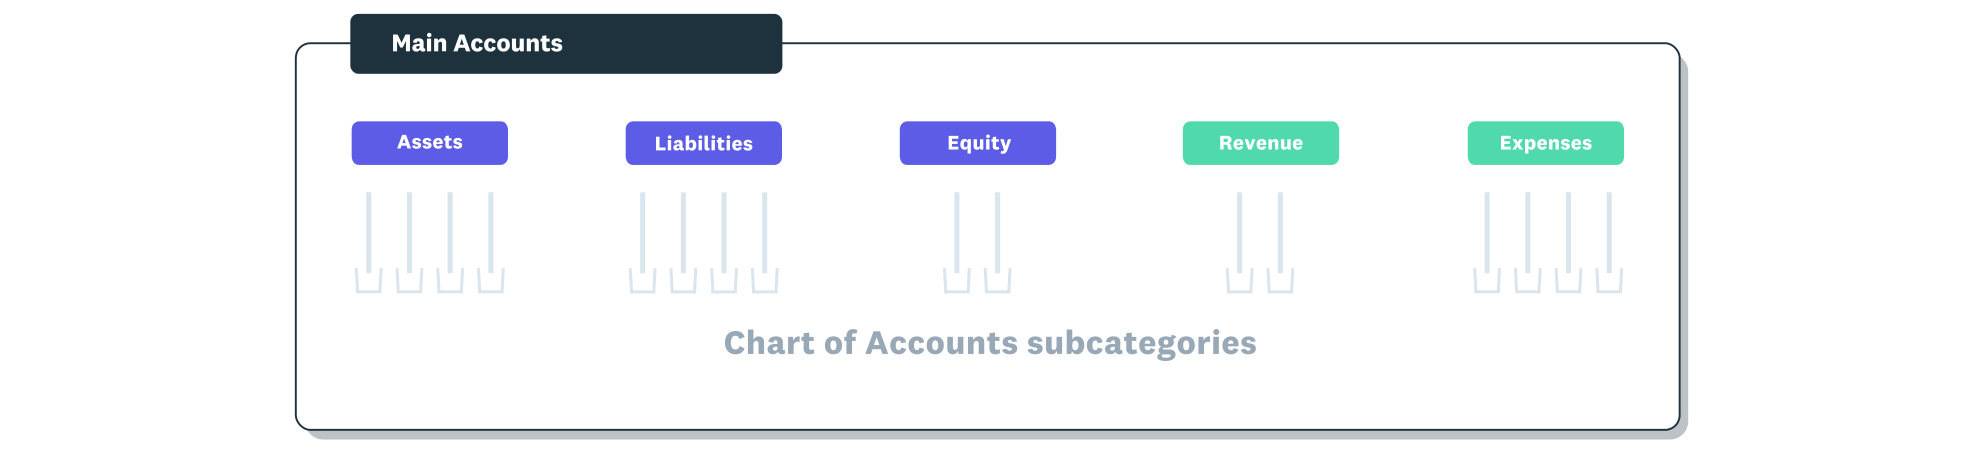
The chart of accounts is organised under the five main account types.
What is a chart of accounts?
A chart of accounts (COA) is a list of all the accounts you use to record financial transactions in your general ledger. Think of it as an index or map that groups similar transactions together, making it easier to find, organise and report on your business finances.
Why is a chart of accounts important?
A well-structured chart of accounts organises every transaction your business makes. This organisation is what powers accurate financial reports and tax returns.
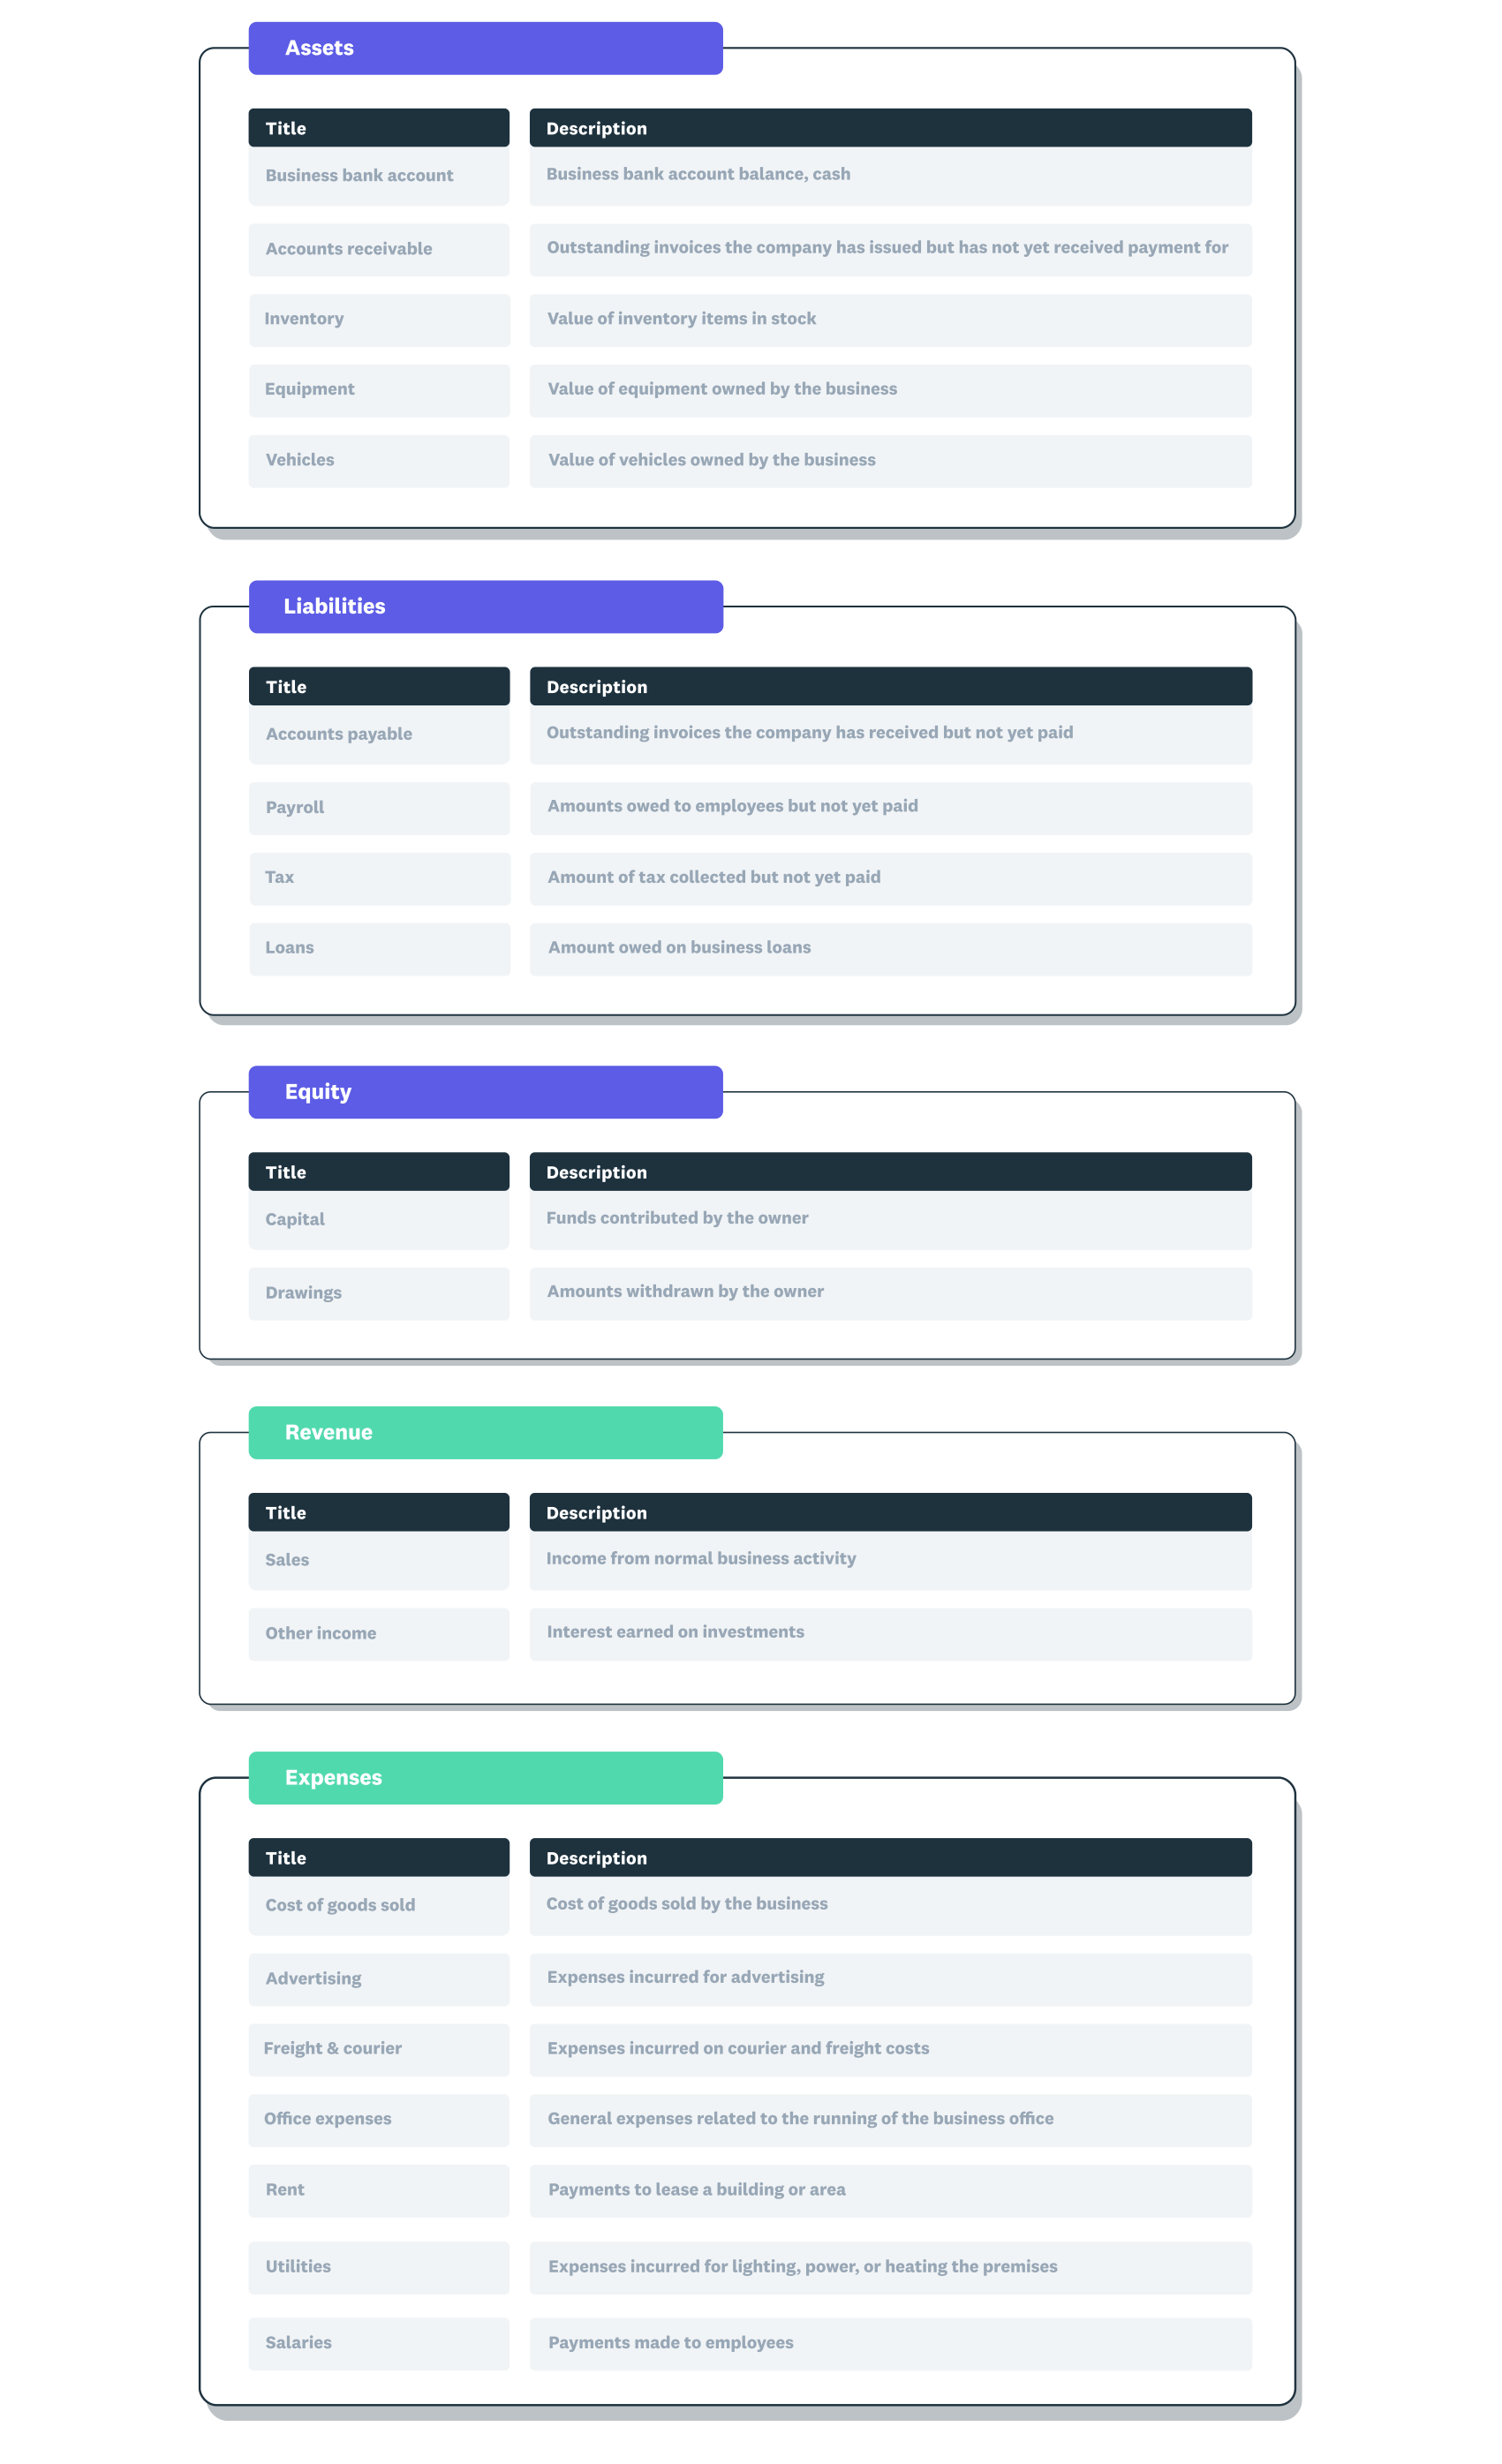
A chart of accounts example showing the five main account types with subcategories within each.
When your accounts are set up correctly, you can see exactly where money comes from and where it goes. This clarity helps you make informed decisions about spending, pricing and growth. Understanding the small business accounting basics starts with getting your chart of accounts right.
The five types of accounts
Every chart of accounts is built around five main account types that capture the full picture of your business finances.
- Asset accounts: things the business owns, such as cash, equipment and inventory
- Liability accounts: debts the business owes, such as loans and accounts payable
- Equity accounts: funds introduced by owners and any owner drawings
- Revenue accounts: money the business earns from sales and other income
- Expense accounts: money the business spends on operations, wages and supplies
These five types connect through the accounting equation: assets equal liabilities plus equity. This equation must always balance, which is the basis of double-entry bookkeeping.
What each account includes
Each account in your chart typically has a name, a short description and a general ledger code. The name identifies the account (for example, "Office rent"), while the code provides a unique reference number for sorting and reporting.
Many businesses also use sub-accounts or subcategories to add detail. Within expenses, for instance, you might have separate accounts for utilities, office costs, rent and travel. This structure helps you record and categorise transactions with precision.
How the numbering system works
Each account has a general ledger code that identifies it within your chart. Codes are usually grouped in ranges by account type, which keeps related accounts together and makes reports easier to read.
A common approach places assets in the 1000s, liabilities in the 2000s, equity in the 3000s, revenue in the 4000s and expenses in the 5000s and above. Leaving gaps between codes (such as 1010, 1020, 1030) gives you room to add new accounts later without renumbering everything.
How to set up a chart of accounts
Setting up a chart of accounts involves planning the accounts your business needs and assigning codes that keep everything organised. It also helps to decide whether you record on a cash or accrual basis before you finalise your structure.
- List your main account types: start with the five categories (assets, liabilities, equity, revenue, expenses).
- Add the accounts your business actually uses: include only the accounts relevant to your operations to keep things manageable.
- Assign a code to each account: use a logical numbering system that groups similar accounts together.
- Group accounts so they map to your financial reports: align your structure with your balance sheet and income statement.
- Review it regularly and adjust as the business grows: add or rename accounts when your business activities change.
Chart of accounts example
Here is a simplified example of what a small business chart of accounts might look like.
- 1000 Business bank account (asset)
- 1200 Accounts receivable (asset)
- 1500 Office equipment (asset)
- 2000 Accounts payable (liability)
- 2100 VAT control (liability)
- 3000 Owner’s equity (equity)
- 4000 Sales revenue (revenue)
- 5000 Rent expense (expense)
Many small businesses run somewhere between 20 and 50 accounts, depending on the complexity of their operations. Start simple and add accounts as your needs grow.
Best practices and common mistakes
A few habits can make your chart of accounts much more useful over time, while certain mistakes can create confusion and extra work.
- Keep it simple: only create accounts you genuinely need
- Stay consistent with naming and codes: use clear, descriptive names and stick to your numbering logic
- Do not mix personal and business accounts: keep them separate for accurate reporting and easier tax returns
- Avoid changing the structure mid-year: make adjustments at period end to keep your reports comparable
- Do not create too many accounts: excessive detail makes reporting harder and increases the chance of errors
Following sound small business bookkeeping practices from the start will save you time later.
Chart of accounts in South Africa
South African businesses usually add a VAT control account to track VAT charged on sales and reclaimed on purchases. VAT is levied at a standard rate of 15% and must be paid over to the South African Revenue Service (SARS).
Your chart of accounts should also align with the reporting standard your business follows, whether that is full IFRS or IFRS for SMEs. Structuring your accounts to match these standards makes year-end reporting and audits smoother.
Set up your chart of accounts with Xero
Xero comes with a ready-made chart of accounts that you can customise to suit your business. You can add, rename or remove accounts as your needs change, and Xero keeps everything organised for your financial reports. Start today and get one month free.
FAQs on chart of accounts
Here are answers to common questions about setting up and using a chart of accounts.
Is a chart of accounts the same as a balance sheet?
No. The chart of accounts lists all your accounts, while the balance sheet is a financial report built from some of them (specifically assets, liabilities and equity).
How many accounts should a small business have?
There is no fixed number. Most small businesses use somewhere between 20 and 50 accounts, depending on the complexity of their operations.
Can I change my chart of accounts after I start recording transactions?
Yes, you can add or adjust accounts at any time. Making changes at period end helps keep your reports comparable across periods.
Is there a standard chart of accounts format?
No single format exists. However, most charts follow the same five account types: assets, liabilities, equity, revenue and expenses.
What are general ledger codes?
General ledger codes are the reference numbers assigned to each account. They help organise your chart and make it easier to sort and report on transactions.
Related terms
Learn more about chart of accounts
Handy resources
Advisor directory
You can search for experts in our advisor directory
Xero Small Business Guides
Discover resources to help you do better business
Online accounting with Xero
Automate your accounting in the cloud
Disclaimer
This glossary is for small business owners. The definitions are written with their requirements in mind. More detailed definitions can be found in accounting textbooks or from an accounting professional. Xero does not provide accounting, tax, business or legal advice.