Chart of accounts (COA)
Learn what a chart of accounts is, the five account types, and how to set one up for accurate reporting.
Published Monday 17 August 2026
Table of contents
Key takeaways
- A chart of accounts is a complete list of every account your business uses to record financial transactions, organised by category.
- The five main account types are assets, liabilities, equity, revenue, and expenses, which together form the foundation of your financial statements.
- A numbering system with assigned ranges for each category keeps your chart of accounts organised and leaves room for growth.
- Reviewing and updating your chart of accounts regularly helps maintain accurate reporting and supports better business decisions.
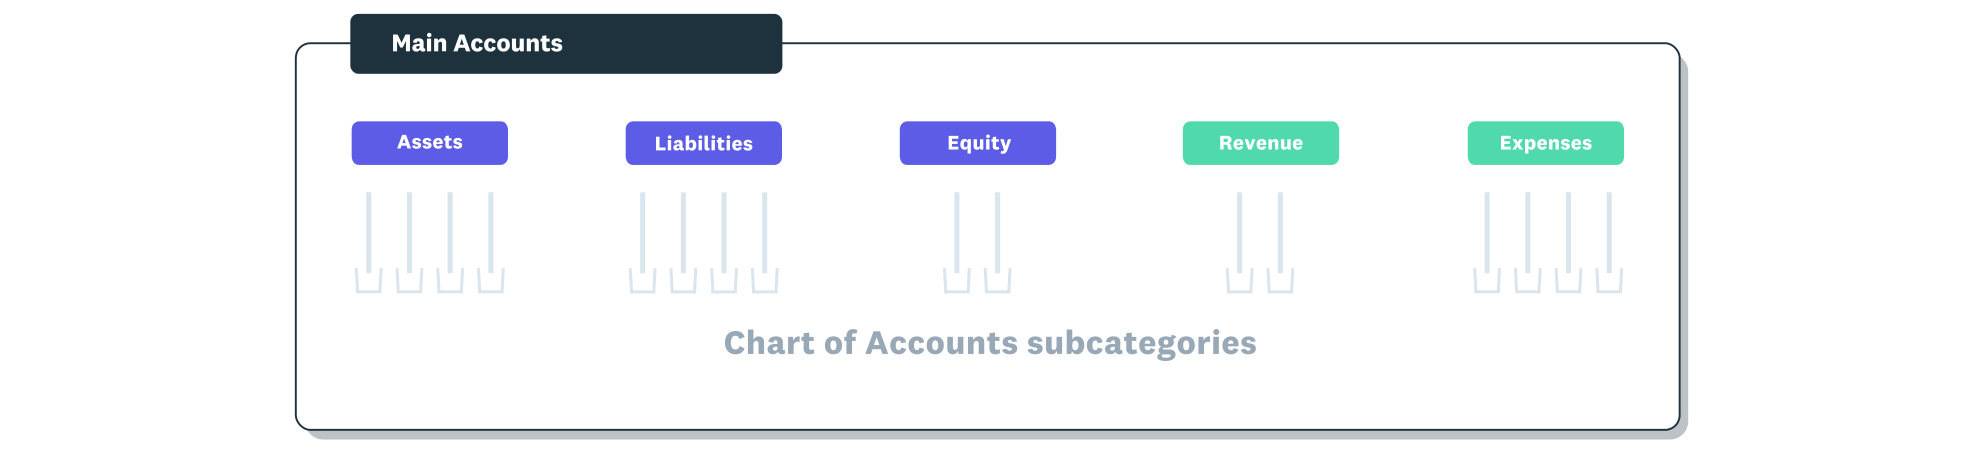
The chart of accounts is organised under the five main account types.
Chart of accounts (definition)
A chart of accounts is a complete index of every financial account in your business, organised into categories that map to your financial statements. Think of it as a filing system that helps you categorise each transaction, whether it's money coming in, money going out, or what your business owns and owes.
Every time you record a sale, pay a bill, or take out a loan, the transaction goes into one of these accounts. The chart of accounts feeds directly into your general ledger, where all transactions are recorded in detail.
How a chart of accounts works
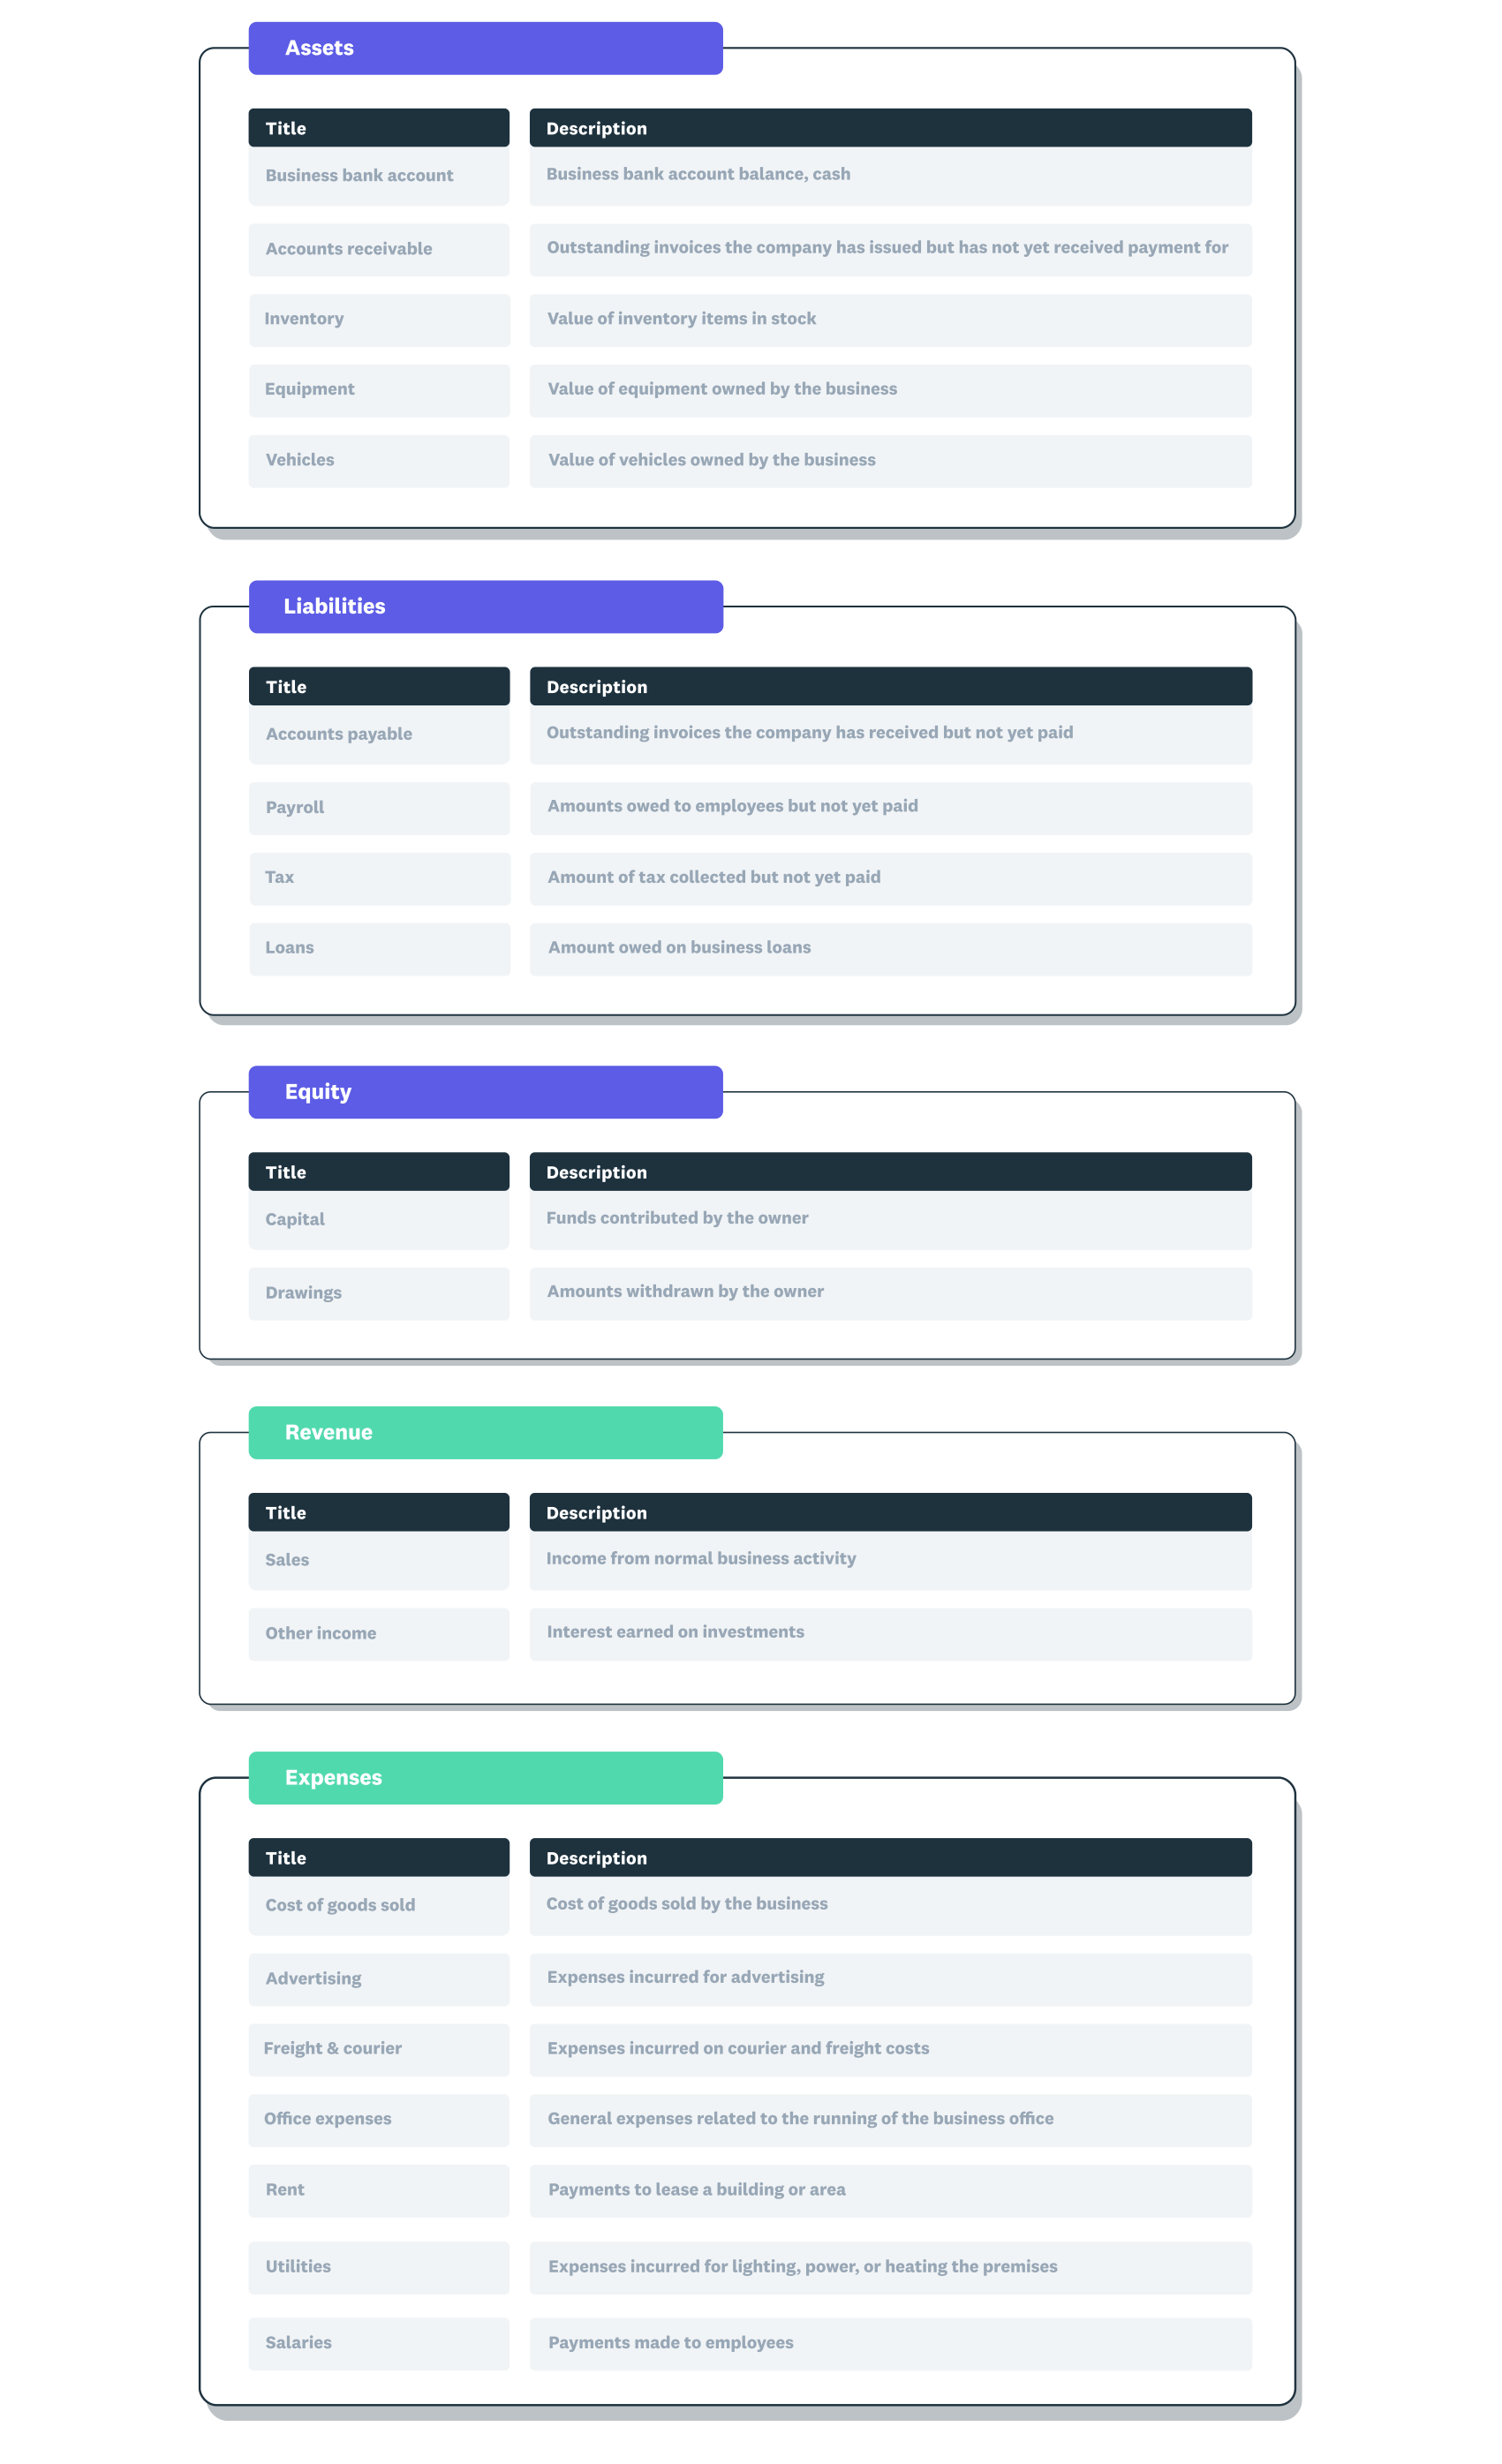
A chart of accounts example showing the five main account types with subcategories within each.
Your chart of accounts serves as the backbone of double-entry bookkeeping. When you record a transaction, it affects at least two accounts, keeping the accounting equation (assets = liabilities + equity) in balance.
The accounts in your chart divide into two groups based on which financial statement they appear on. Balance sheet accounts (assets, liabilities, and equity) track what your business owns, owes, and the owner's stake at a point in time. Profit and loss accounts (revenue and expenses) track income earned and costs incurred over a period, showing whether your business made or lost money.
By linking every transaction to a specific account, your chart of accounts turns raw data into organised reports. Your balance sheet and income statement draw their figures directly from these account balances.
The main types of accounts
Every chart of accounts is built around five core account types. These categories cover everything a business needs to track financially.
- Assets: resources your business owns that have value, such as cash, bank accounts, inventory, equipment, and accounts receivable.
- Liabilities: debts and obligations your business owes to others, including loans, accounts payable, and accrued expenses.
- Equity: the owner's claim on the business after liabilities are subtracted from assets, including retained earnings and capital contributions.
- Revenue: income earned from your core business activities, such as sales of products or services.
- Expenses: costs incurred to run the business, such as rent, utilities, wages, and office supplies.
Within each category, you can customise sub-accounts to match your operations. Under expenses, for example, you might have separate accounts for utilities, rent, office expenses, and travel. This level of detail helps you see exactly where money is going without cluttering your reports.
Chart of accounts numbering system
A common numbering convention assigns each account a code so you can sort and locate it quickly. Small businesses often use three-digit numbers, while larger businesses may use four or more digits to accommodate more accounts.
Number ranges are typically assigned by category, with gaps left between accounts for future additions. A standard setup might look like this:
- Assets: 1000–1999
- Liabilities: 2000–2999
- Equity: 3000–3999
- Revenue: 4000–4999
- Expenses: 5000–5999
Leaving gaps (for example, numbering your first few expense accounts 5000, 5010, 5020) gives you room to add new accounts later without disrupting the order.
Example of a chart of accounts
A simple chart of accounts for a small retail business might include the following coded accounts. Each account sits within its assigned number range and maps to one of the five categories.
- 1000: Cash
- 1010: Bank account
- 1100: Accounts receivable
- 1200: Inventory
- 2000: Accounts payable
- 2100: Short-term loan
- 3000: Owner's equity
- 3100: Retained earnings
- 4000: Sales revenue
- 5000: Rent expense
- 5010: Utilities expense
- 5020: Wages expense
This structure keeps transactions easy to find and ensures reports pull accurate totals from each category.
How to set up a chart of accounts
Setting up a chart of accounts involves understanding your business activities and organising them into a clear structure. Follow these steps to get started.
- Assess your business and its activities. Identify the types of transactions you handle, such as sales, purchases, payroll, and loans.
- Group accounts under the five main types. Decide which assets, liabilities, equity, revenue, and expense accounts you need based on your operations.
- Assign account numbers. Choose a numbering system with ranges for each category and leave gaps for future accounts.
- Add names and short descriptions. Give each account a clear, descriptive name so anyone reviewing your books understands its purpose.
- Review and refine over time. As your business grows, revisit your chart of accounts to add, merge, or archive accounts as needed.
Starting with small business accounting software can simplify this process, since most platforms provide a default chart of accounts you can customise.
Chart of accounts best practices
A well-maintained chart of accounts makes reporting faster and more reliable. Keep these practices in mind.
- Keep it lean. Include only the accounts you need for meaningful reporting. Too many accounts create clutter; too few hide useful detail.
- Be consistent. Use the same naming conventions and numbering logic throughout. Consistency makes it easier to train staff and compare periods.
- Review periodically. At least once a year, check for unused accounts, duplicate categories, or gaps that need filling.
- Avoid mid-period changes. Adding or deleting accounts in the middle of a reporting period can distort comparisons. Plan structural changes for the start of a new period.
- Document your structure. Keep a reference guide that explains what each account is for, especially if multiple people handle bookkeeping.
Common chart of accounts mistakes
Even small missteps in your chart of accounts can lead to confusing reports and wasted time. Watch out for these common errors.
- Creating too many accounts. Excessive detail makes reports harder to read and increases the risk of misposting transactions.
- Creating too few accounts. Lumping unrelated expenses together hides spending patterns and makes budgeting harder.
- Deleting accounts mid-period. Removing an account with a balance can throw off your financial statements and audit trail.
- Inconsistent categorisation. Posting similar transactions to different accounts (for example, sometimes to "office supplies" and sometimes to "general expenses") skews your data.
- Ignoring the chart of accounts after setup. Failing to update your structure as your business evolves leads to outdated categories that no longer reflect reality.
Why a chart of accounts matters
A well-structured chart of accounts gives you an overview of every area of your business that spends or earns money. When accounts are logically organised, you can quickly spot trends, compare periods, and identify problem areas.
Accurate categorisation also supports reliable financial reporting. Your profit and loss statement and balance sheet depend on transactions being posted to the right accounts. If the underlying data is messy, your reports will be too.
Beyond day-to-day management, a clear chart of accounts helps during audits and tax time. Auditors and accountants can follow your records more easily when accounts are named clearly and numbered consistently. This transparency builds confidence in your numbers and speeds up compliance work.
Set up your chart of accounts with Xero
Xero gives you a default chart of accounts when you create your organisation, so you can start recording transactions straight away. You can add, edit, or archive accounts at any time to match your business structure, and every change syncs across your reports automatically.
With bank feeds, transaction rules, and reporting dashboards built in, Xero helps you keep your accounts accurate without manual data entry. Ready to organise your finances? Get one month free and see how Xero simplifies your bookkeeping.
FAQs on chart of accounts
Here are answers to common questions about setting up and using a chart of accounts.
What are the 5 types of accounts in a chart of accounts?
The five types are assets, liabilities, equity, revenue, and expenses. Assets and liabilities appear on the balance sheet, while revenue and expenses appear on the income statement. Equity connects the two.
Is a chart of accounts the same as a general ledger?
No. The chart of accounts is the list of account names and numbers, while the general ledger contains the detailed transaction records posted to those accounts. The chart of accounts is the structure; the general ledger is the content.
How many accounts should a chart of accounts have?
There is no fixed rule. Many small businesses run comfortably with a couple of dozen accounts, while larger businesses may use hundreds. The right number depends on how much detail you need for reporting without creating unnecessary complexity.
Is a chart of accounts the same as a balance sheet?
No. A balance sheet is a financial report showing assets, liabilities, and equity at a specific date. The chart of accounts is the underlying structure that feeds data into the balance sheet and other reports.
Do I need a chart of accounts?
Yes, if you want organised financial records. A chart of accounts is essential for producing accurate reports, filing taxes, and understanding where your money goes. Even the simplest bookkeeping system relies on one.
Related terms
Learn more about chart of accounts
Handy resources
Advisor directory
You can search for experts in our advisor directory
Xero Small Business Guides
Discover resources to help you do better business
Online accounting with Xero
Automate your accounting in the cloud
Disclaimer
This glossary is for small business owners. The definitions are written with their requirements in mind. More detailed definitions can be found in accounting textbooks or from an accounting professional. Xero does not provide accounting, tax, business or legal advice.