Australia Small Business Insights
This analysis focuses on core performance metrics of sales growth, jobs growth, wages growth, late payments and time to be paid.

Slight slowdown as rate rises and fuel prices impact
Published: 30 July 2026
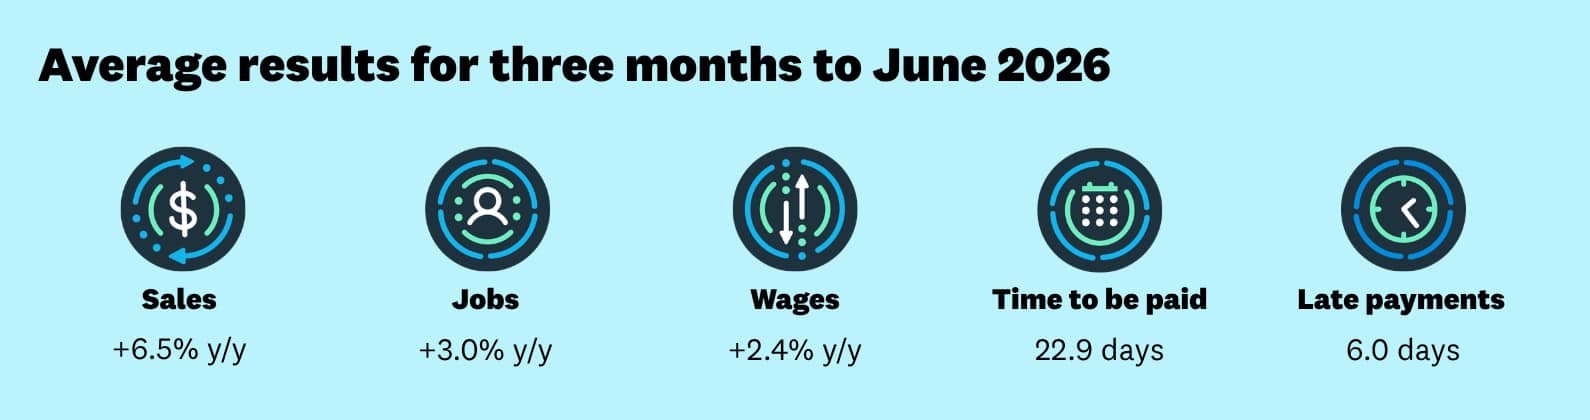
The latest Xero Small Business Insights (XSBI) data for Australia shows some of the momentum went out of the economy in the June quarter as interest rate hikes and higher-than-normal fuel prices started to take effect. Sales grew a still healthy 6.5% year-on-year (y/y) and jobs growth was a solid 3.0%, although both measures were lower than in the March quarter. Payment times both improved sharply, largely due to end-of-financial-year effects.
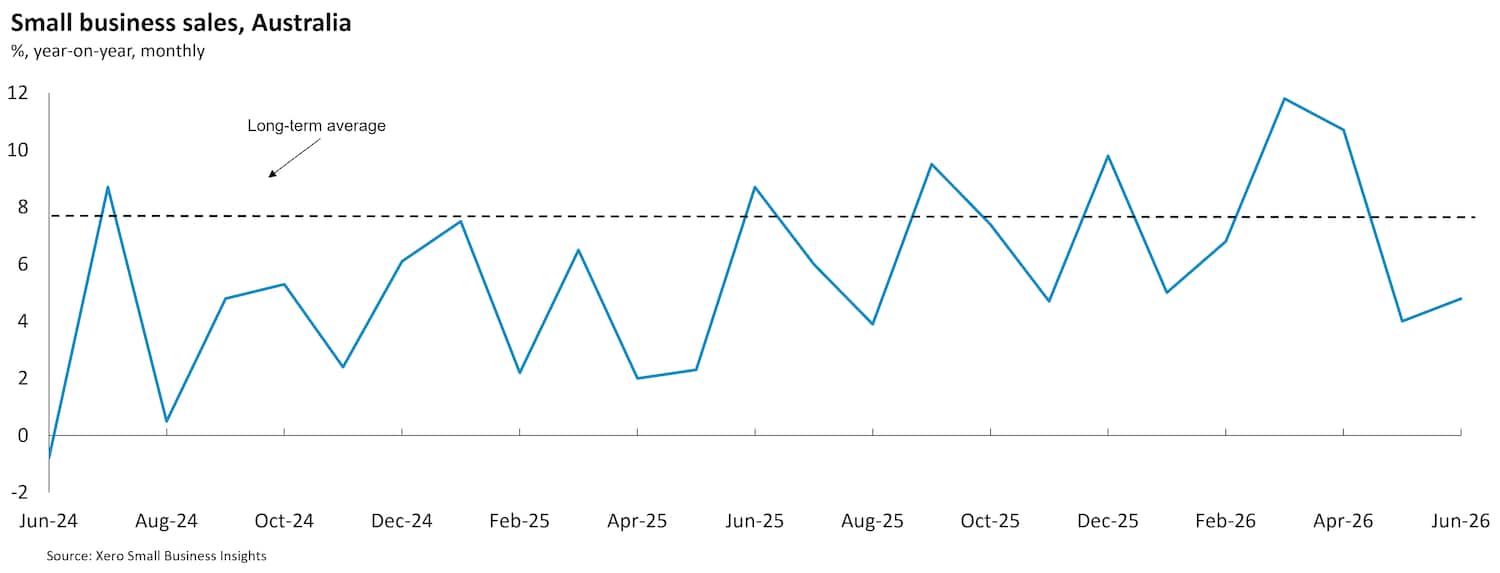
Sales in small businesses grew 6.5% (y/y) in the June quarter, down from 7.9% y/y in the March quarter and just below the historical average for the series (also 7.9% y/y). Breaking down the monthly movements over the quarter, sales rose 10.7% y/y in April but then slowed sharply to 4.0% y/y in May and 4.8% y/y in June. The outcomes for the latter two months highlight that the three interest rates by the Reserve Bank of Australia (RBA) so far this year and the elevated fuel prices, due to the conflict in the Middle East, have likely crimped small business sales.
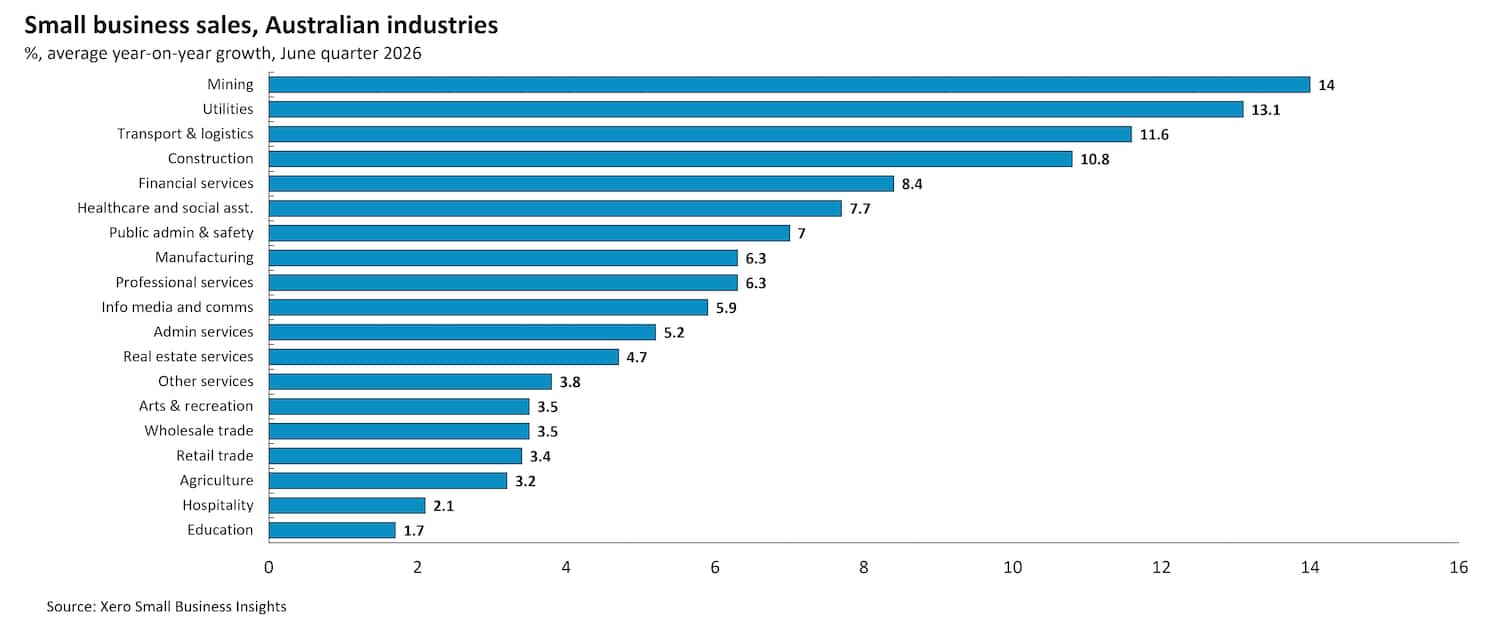
The industry breakdown of sales shows substantial variation, with some of the interest-rate sensitive industries and those dependent on discretionary consumer spending recording the smallest sales rises and sharpest slowdowns in spending growth between the March and June quarters. This includes real estate services (+4.7% y/y), retail trade (+3.4% y/y), hospitality (+2.1% y/y), arts & recreation (+3.5% y/y) and other services (+3.8% y/y). There were other sectors much less impacted including mining (+14.0% y/y) and utilities (+13.1% y/y) - both new industry splits for the XSBI program - and construction (+10.8% y/y), a consistently solid performer in recent quarters.
The variation across states was less pronounced. The Australian Capital Territory (+3.4% y/y) was by far the softest sales performer. Next were the two biggest states, NSW (+6.1% y/y) and Victoria (+5.3% y/y). The strongest region was the newly added Northern Territory (+8.4% y/y), up from a 3.2% y/y rise in the March quarter. Queensland (+8.2% y/y) was the second strongest performer, likely helped by its mining industry.
Some of the momentum went out of the economy in the June quarter as interest rate hikes and higher-than-normal fuel prices started to take effect
XSBI Australia April 2026 - June 2026 data
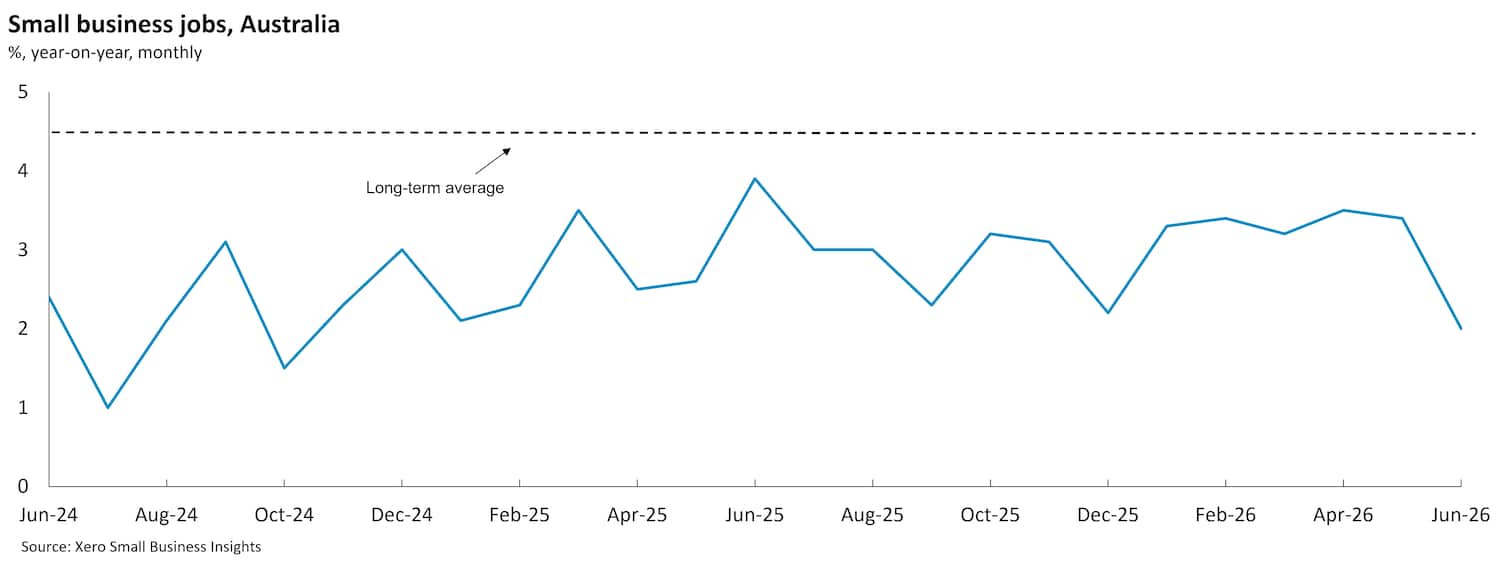
Jobs growth also slowed slightly in the quarter, with jobs up 3.0% y/y compared to 3.3% y/y in the March quarter. There was a particularly sharp slowdown in the month of June, when jobs were only 2.0% higher than a year ago. The three strongest sales performers also led the jobs gains - mining (+7.6% y/y), utilities (+8.6% y/y) and construction (+5.7% y/y). Hospitality (-0.9% y/y) was the only industry to report fewer jobs than a year ago.
This softness in the labour market was also reflected in wages, which rose a modest 2.4% y/y in the June quarter. This was slightly slower than the 2.7% y/y rise in the March quarter. The largest wage rises were paid to construction workers (+3.1% y/y) and hospitality staff (+3.0% y/y).
Both payment time metrics improved, largely due to seasonal factors. At the end of the financial year (June) we observe improvements in the first estimate of the payment times metrics. This improvement is often revised up as we get subsequent information, so treat the results for June and the quarter with caution.
The average length of time small businesses waited to be paid, after issuing an invoice, was 22.9 days - after 24.2 days in the March quarter. Small businesses were paid, on average, 6.0 days late in the June quarter, down from 6.9 days in the March quarter.
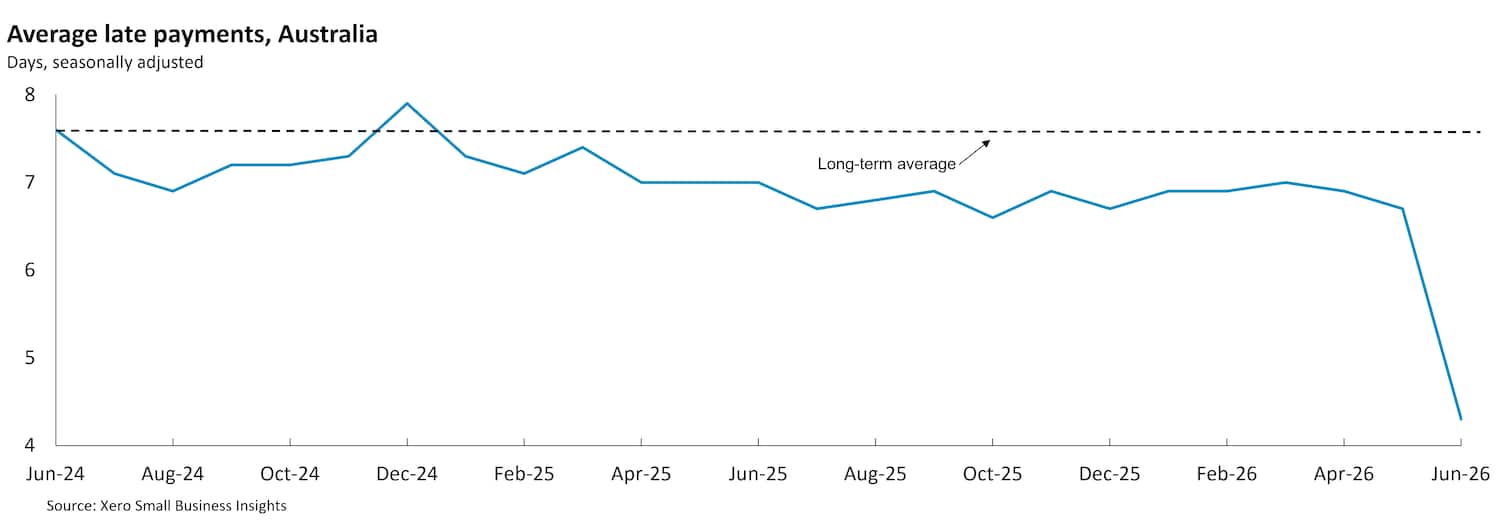
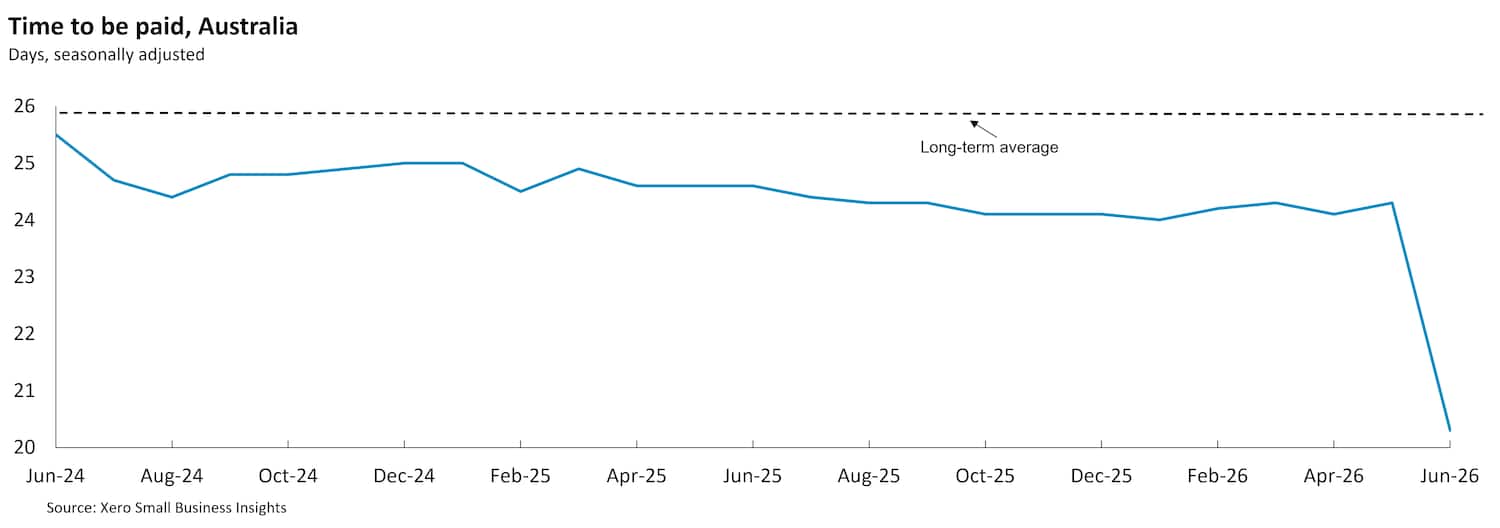
Overall, the impact of three interest rate rises and higher-than-normal fuel prices started to impact customers and small business sales in May and June, taking the shine of what had been a strong start to the year.
Looking ahead, in its latest forecast the OECD expects Australian GDP to grow 1.9% in 2026, similar to the 2.0% in 2025. The think-tank noted that the economy had considerable momentum on the eve of the evolving Middle East conflict but now faces headwinds that will hinder growth and push up inflation this year.
This narrative is consistent with the RBA's commentary, after it decided to leave the cash rate on hold at 4.35% at its June meeting. There continue to be heightened uncertainties about the outlook for domestic economic activity and inflation. Global oil supply issues will take some time to resolve, maintaining upward pressure on global energy prices and inflation. At the same time, a period of prolonged uncertainty may also cause growth to be lower in Australia’s major trading partners and in Australia.
The return of hostilities between the US and Iran in July introduces renewed uncertainty about economic growth in the second half of the year. In addition, profit margins and cash flow will continue to be under-pressure as small businesses are squeezed between rising input costs (including, and potentially beyond, fuel) and increasingly hesitant customers.
For more information on the XSBI metrics, see our methodology page.

Disclaimer
This report was prepared using Xero Small Business Insights data and publicly available data for the purpose of informing and developing policies to support small businesses.
This report includes and is in parts based on assumptions or estimates. It contains general information only and should not be taken as taxation, financial, investment or legal advice. Xero recommends that readers always obtain specific and detailed professional advice about any business decision.
The insights in this report were created from the data that was available as at the date it was extracted. Data used was anonymised and aggregated to ensure individual businesses can not be identified.
Find out more about XSBI
If you have any questions about Xero Small Business Insights, reach out to us.