Current ratio explained: formula, examples and tips
Learn what the current ratio tells you about liquidity, and how to use it to guide cash flow and smarter decisions.
Written by Jotika Teli—Certified Public Accountant with 24 years of experience. Read Jotika's full bio
Published Monday 23 February 2026
Table of contents
Key takeaways
- Calculate your current ratio monthly by dividing current assets by current liabilities to track your business's ability to pay short-term debts, aiming for a ratio between 1.5 and 3.0 for optimal financial health.
- Improve a low current ratio by collecting accounts receivable faster, reducing excess inventory, negotiating extended payment terms with suppliers, and converting short-term debt to long-term financing.
- Recognise that a current ratio below 1.0 signals potential cash flow problems, while a ratio consistently above 3.0 may indicate you're holding too much idle cash that could be invested in business growth.
- Compare your current ratio to industry benchmarks rather than general guidelines, as different sectors have varying liquidity needs and operating patterns that affect what constitutes a healthy ratio.
What is current ratio?
The current ratio measures your business's ability to pay short-term debts using short-term assets. A higher ratio means you're better positioned to cover upcoming bills and loan repayments. For example, one study found that a business with a current ratio of 1.47 had a predicted failure rate of 1.8%, compared to 3.5% for a business with a ratio of just 0.35.
You might also see it called the working capital ratio. Unlike the quick ratio, current ratio includes all current assets, even those that take longer to convert to cash, like inventory.
Components of current ratio
To calculate your current ratio, you need two numbers from your balance sheet: current assets and current liabilities. Understanding what falls into each category helps you get an accurate result.
Current assets
Current assets are resources your business can convert to cash within 12 months. Common examples include:
- Cash and cash equivalents: money in bank accounts and short-term investments
- Accounts receivable: money customers owe you for goods or services
- Inventory: products you hold for sale
- Prepaid expenses: payments made in advance, like insurance or rent
Current liabilities
Current liabilities are debts and obligations due within 12 months. Common examples include:
- Accounts payable: money you owe suppliers
- Short-term loans: borrowings due within one year
- Accrued expenses: costs incurred but not yet paid, like wages or utilities
- Current portion of long-term debt: loan payments due in the next 12 months
How to calculate current ratio
You need to know your current assets and current liabilities to do a current ratio calculation. Fortunately, both of these amounts can be found on your balance sheet.
- Current assets include cash, accounts receivable, inventory, and other assets that you expect to convert into cash within a year.
- Current liabilities are the obligations your business must pay within the same period, such as accounts payable, short-term loans, and other debts.
Here's the current ratio formula:
Current ratio = Current assets ÷ Current liabilities
Both figures come directly from your balance sheet, making this a straightforward calculation.
Example of a current ratio calculation
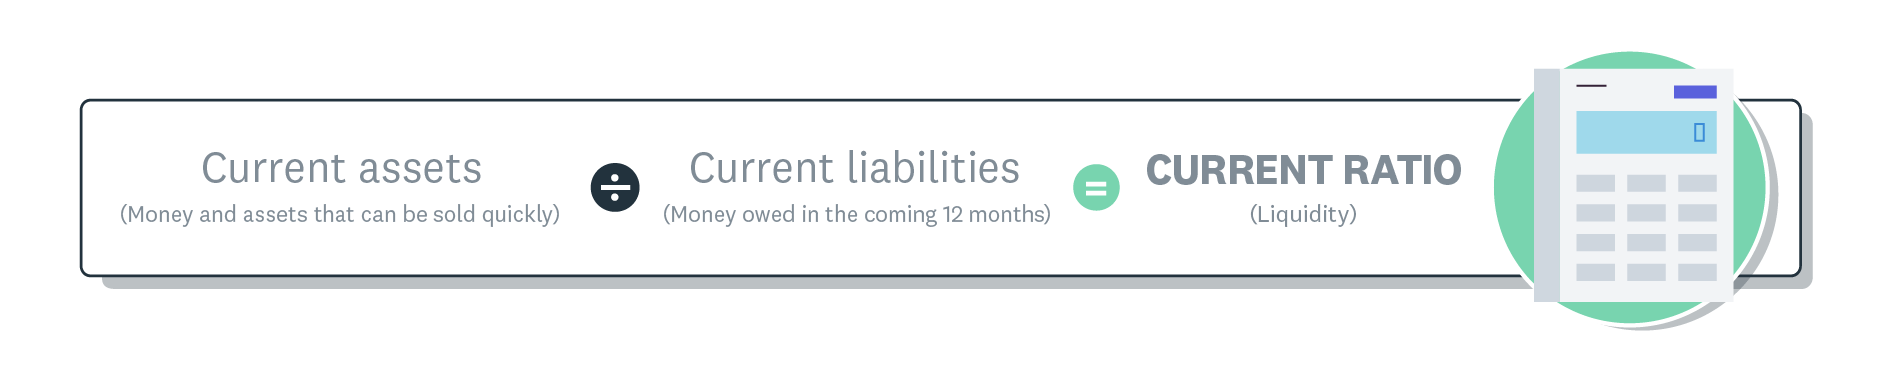
Current ratio liquidity formula.
A small construction business wants to work out its current ratio to see if it can cover upcoming loan repayments and material costs.
The business has $250,000 in current assets and $175,000 in current liabilities. The current ratio calculation is:
$250,000 / $175,000 = 1.43
The current ratio is above one, which means the business can cover upcoming liabilities. For every $1 of liabilities, the business has $1.43 available.
You might also invest in other areas with the remaining cash. Or you could hold onto your extra cash in case your assets drop and liabilities rise.
How to interpret your current ratio
A current ratio of 1.0 or higher indicates your business can cover its short-term debts and is generally in good financial health.
A ratio below 1.0 means your current liabilities exceed your current assets. This isn't always cause for alarm. Growing businesses often see temporary dips when investing in expansion.
However, a ratio that stays below 1.0 long-term may signal significant risk; research shows that businesses with very low ratios have a much higher predicted five-year failure rate (20.8% at a 0.35 ratio) than those with healthier ratios (8.7% at a 2.17 ratio).
A ratio that's consistently very high (above 3.0) might suggest you're holding too much cash or inventory. Consider whether you could invest more in growth.
The current ratio fluctuates throughout your billing cycle. Measure it at the same time each month to spot trends and compare like for like.
Current ratio is just one view of your finances. Combine it with other profitability ratios and cash flow forecasts for a complete picture.
What is a good current ratio?
A good current ratio typically falls between 1.5 and 3.0 for most small businesses. This range shows you have enough assets to cover your debts while still putting your resources to work.
Interpret different ranges as follows:
- Below 1.0: Your liabilities exceed your assets. You may struggle to pay bills on time.
- 1.0 to 1.5: You can cover your debts, but there's little buffer for unexpected expenses.
- 1.5 to 3.0: A healthy range for most businesses. You have adequate liquidity without holding excessive idle assets.
- Above 3.0: You may have too much cash or inventory sitting unused. Consider investing in growth.
What's considered "good" varies by industry. For example, the biotechnology industry has an average current ratio of 5.08, while the airline industry averages just 0.58. Retail businesses with fast-moving inventory often operate successfully with lower ratios, while service businesses with fewer physical assets may have higher ratios.
Compare your ratio to industry benchmarks for the most relevant insight.
How to improve your current ratio
If your current ratio is lower than you'd like, take these practical steps to strengthen your liquidity.
- Collect accounts receivable faster: Send invoices promptly, offer early payment discounts, and follow up on overdue accounts. Collecting faster converts receivables to cash sooner.
- Reduce excess inventory: Review stock levels and clear slow-moving items. Less inventory tied up means more liquid assets available.
- Negotiate better payment terms: Ask suppliers for extended payment windows. Longer terms reduce the immediate pressure on your current liabilities.
- Refinance short-term debt: Convert short-term loans to long-term financing where possible. This moves debt out of current liabilities.
- Cut unnecessary expenses: Review operating costs and eliminate waste. Lower expenses preserve cash and improve your asset position.
- Increase sales revenue: More sales bring in more cash. Focus on profitable products or services that generate quick returns.
Track your ratio monthly to see how these changes affect your liquidity over time.
Current ratio vs quick ratio and other liquidity ratios
Current ratio is one of several liquidity ratios you can use to assess your financial health. Each ratio offers a different perspective on your ability to pay debts.
- Quick ratio (acid test ratio): Excludes inventory and only counts assets convertible to cash within 90 days. This gives a more conservative view of liquidity.
- Cash ratio: Compares only cash and cash equivalents to current liabilities, excluding all other assets. This is the most stringent measure.
Using multiple ratios together shows how much cash you have available for various needs. Learn more in our guide to liquidity ratios.
Current ratio in relation to working capital and cash flow
Current ratio and working capital are closely related. Both use the same inputs (current assets and current liabilities) but express the result differently. Current ratio is a proportion; working capital is a dollar amount.
Current ratio connects to other key financial metrics:
- Working capital: The monetary difference between current assets and current liabilities. It shows how much money remains after covering short-term obligations.
- Cash flow: The net movement of money in and out of your business over a period. It tracks actual cash availability, not just asset values.
- Free cash flow: Operating cash flow minus capital expenditure. It shows how much cash remains after investing in equipment, property, or other long-term assets.
Tracking these metrics together gives you a complete picture of your business's finances and spending power.
What are the limitations of using the current ratio?
Like all liquidity ratios, current ratio only provides a snapshot of your finances at a single point in time. Consider these limitations when interpreting your results.
- It treats all current assets equally. Cash is immediately available to spend. Inventory might take months to sell. The ratio doesn't distinguish between them.
- It ignores timing. The ratio assumes all liabilities are due at once, which isn't realistic. Cash flow changes daily, and payment due dates vary.
- It can mislead seasonal businesses. If you calculate your ratio during a slow period, it may look worse than your annual average. High-sales periods may inflate it temporarily.
For a complete picture, combine current ratio with cash flow forecasts and other financial metrics.
Track your current ratio with Xero
Monitor your current ratio and other financial metrics without the complexity. With real-time dashboards and automated calculations, you can track your liquidity without spreadsheets or manual work.
With Xero, you can:
- View your balance sheet in real time: Access current assets and liabilities figures updated automatically from bank feeds
- Monitor trends over time: Track how your current ratio changes month to month with visual reporting
- Generate reports quickly: Create financial statements for lenders or investors with a few clicks
- Spot issues early: Set up alerts when key metrics fall outside your target range
Get one month free and take control of your financial metrics today.
FAQs on current ratio
Common questions about current ratio and how to use it for your business.
What is a good current ratio?
A good current ratio is typically between 1.5 and 3.0, though this varies by industry. A ratio above 1.0 means you can cover your short-term debts.
What does a current ratio of 2.5 mean?
A current ratio of 2.5 means you have $2.50 in current assets for every $1 of current liabilities. This indicates strong liquidity and the ability to comfortably meet short-term obligations.
Is 1.0 a good current ratio?
A current ratio of 1.0 means your current assets exactly equal your current liabilities. While you can technically cover your debts, there's no buffer for unexpected expenses, so most businesses aim higher.
How often should I calculate my current ratio?
Calculate your current ratio monthly, at the same point in your billing cycle each time. This consistency helps you spot trends and compare results accurately.
Can my current ratio be too high?
Yes. A ratio consistently above 3.0 may indicate you're holding too much cash or inventory that could be invested in growth. Review whether your assets are working efficiently for your business.
Disclaimer
Xero does not provide accounting, tax, business or legal advice. This guide has been provided for information purposes only. You should consult your own professional advisors for advice directly relating to your business or before taking action in relation to any of the content provided.
Start using Xero for free
Access Xero features for 30 days, then decide which plan best suits your business.