United Kingdom Small Business Insights
This analysis focuses on core performance metrics of sales growth, jobs growth, wages growth, late payments and time to be paid.

Modest national sales result hides industry differences
Published: 29 October 2026
The latest Xero Small Business Insights (XSBI) data for the UK shows a modest slowdown in sales growth and small rise in payment times during the three months to September. The main positive in the quarter is that jobs growth picked up again, after a dip in the June quarter. These national results hide significant differences across industries, with agriculture, hospitality and retail trade all performing below the national average and transport and logistics, manufacturing, construction and professional services outperforming.
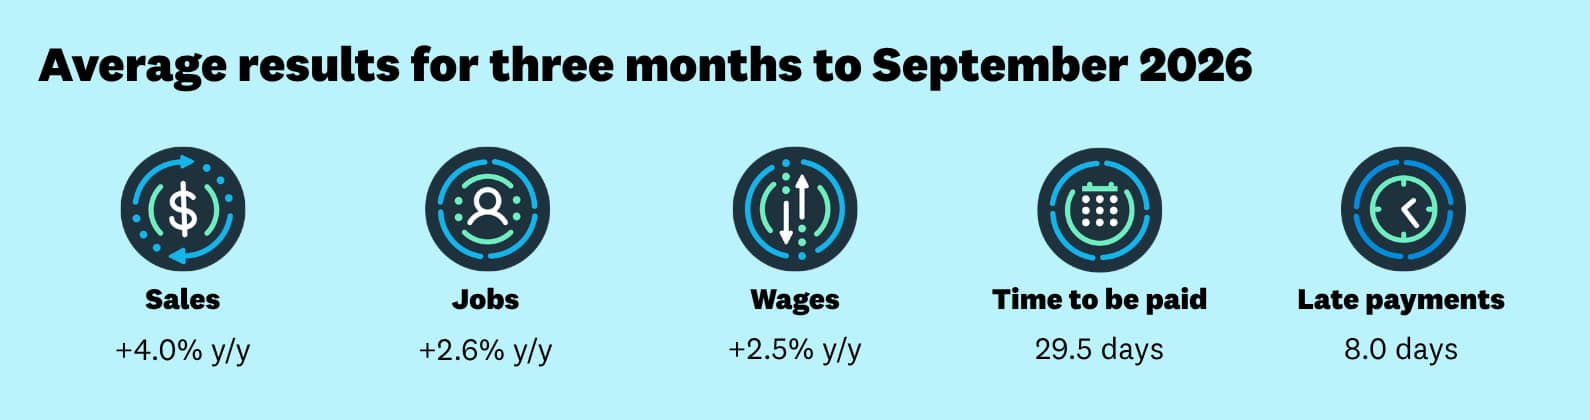
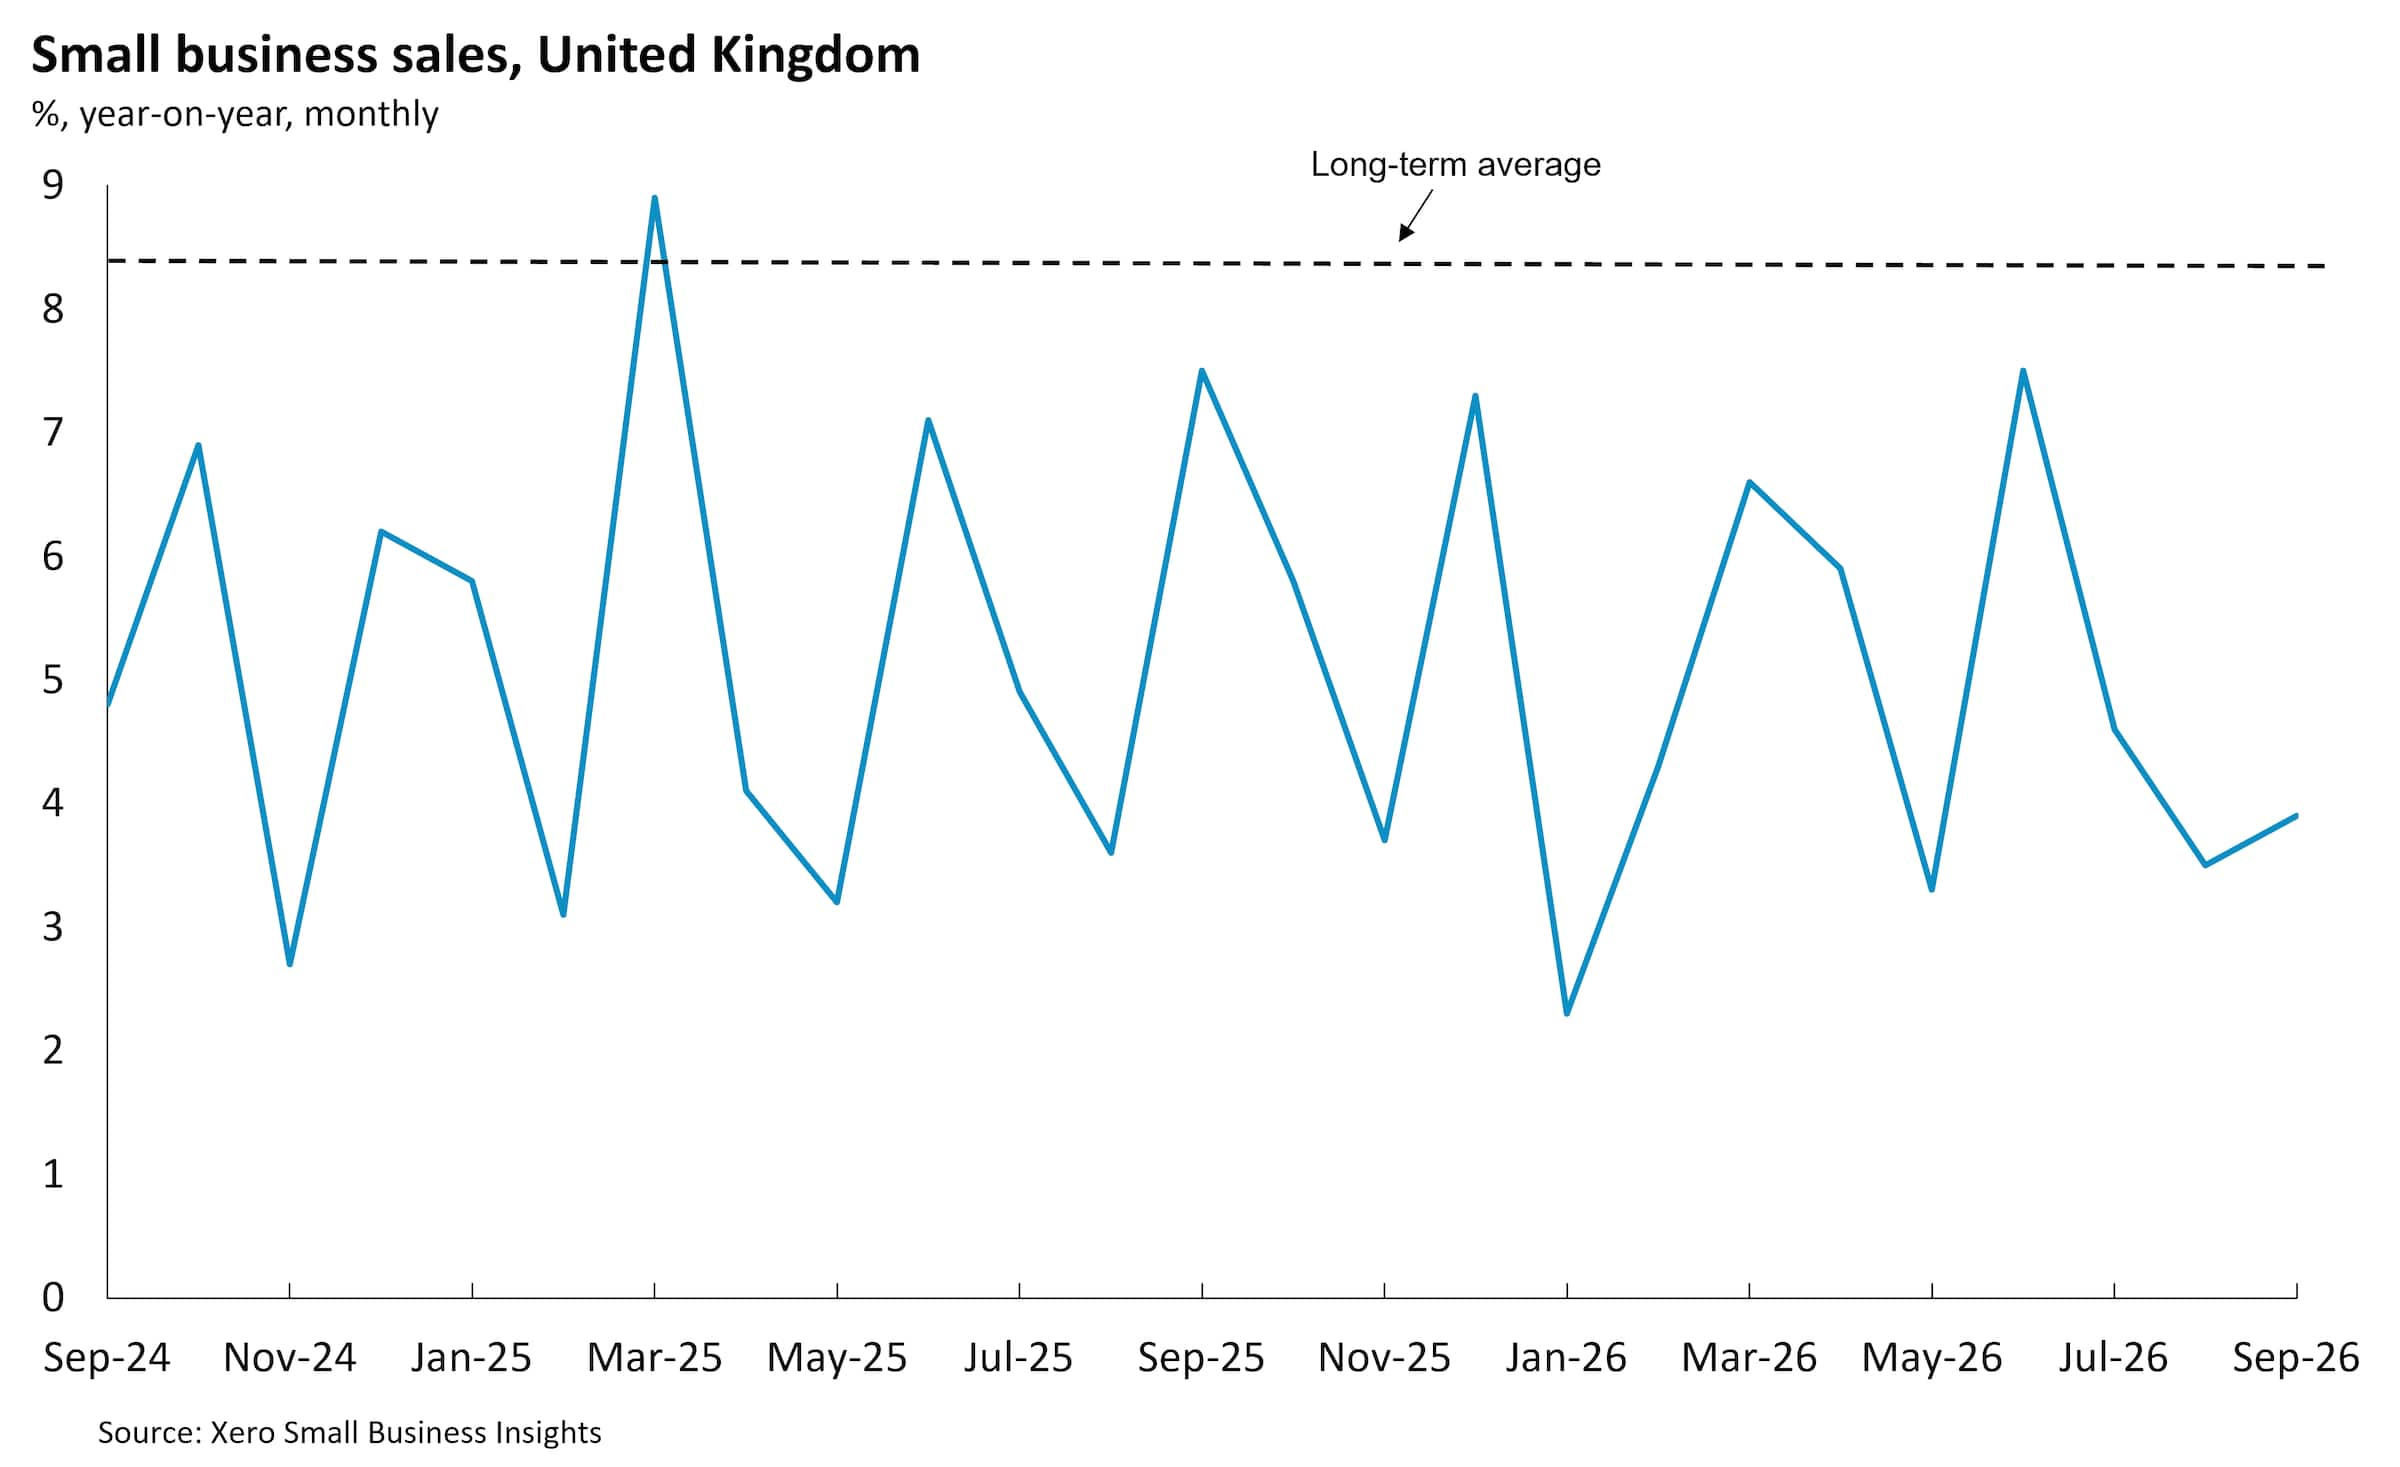
Small business sales grew 4.0% y/y in the September quarter, after a 5.6% y/y rise in the June quarter (revised up from 3.6% y/y initially reported). Sales growth is now less than half its historical average of 8.4% y/y. Sales for the month of June were revised higher, to 7.5% y/y (from 4.8% y/y initially reported). Since then sales have lost some momentum, rising 4.6% y/y in July, 3.5% y/y in August and 3.9% y/y in September. This slowdown likely reflects the ongoing impact of higher-than-normal fuel prices which is feeding into inflation more broadly and limiting the capacity of households to spend.
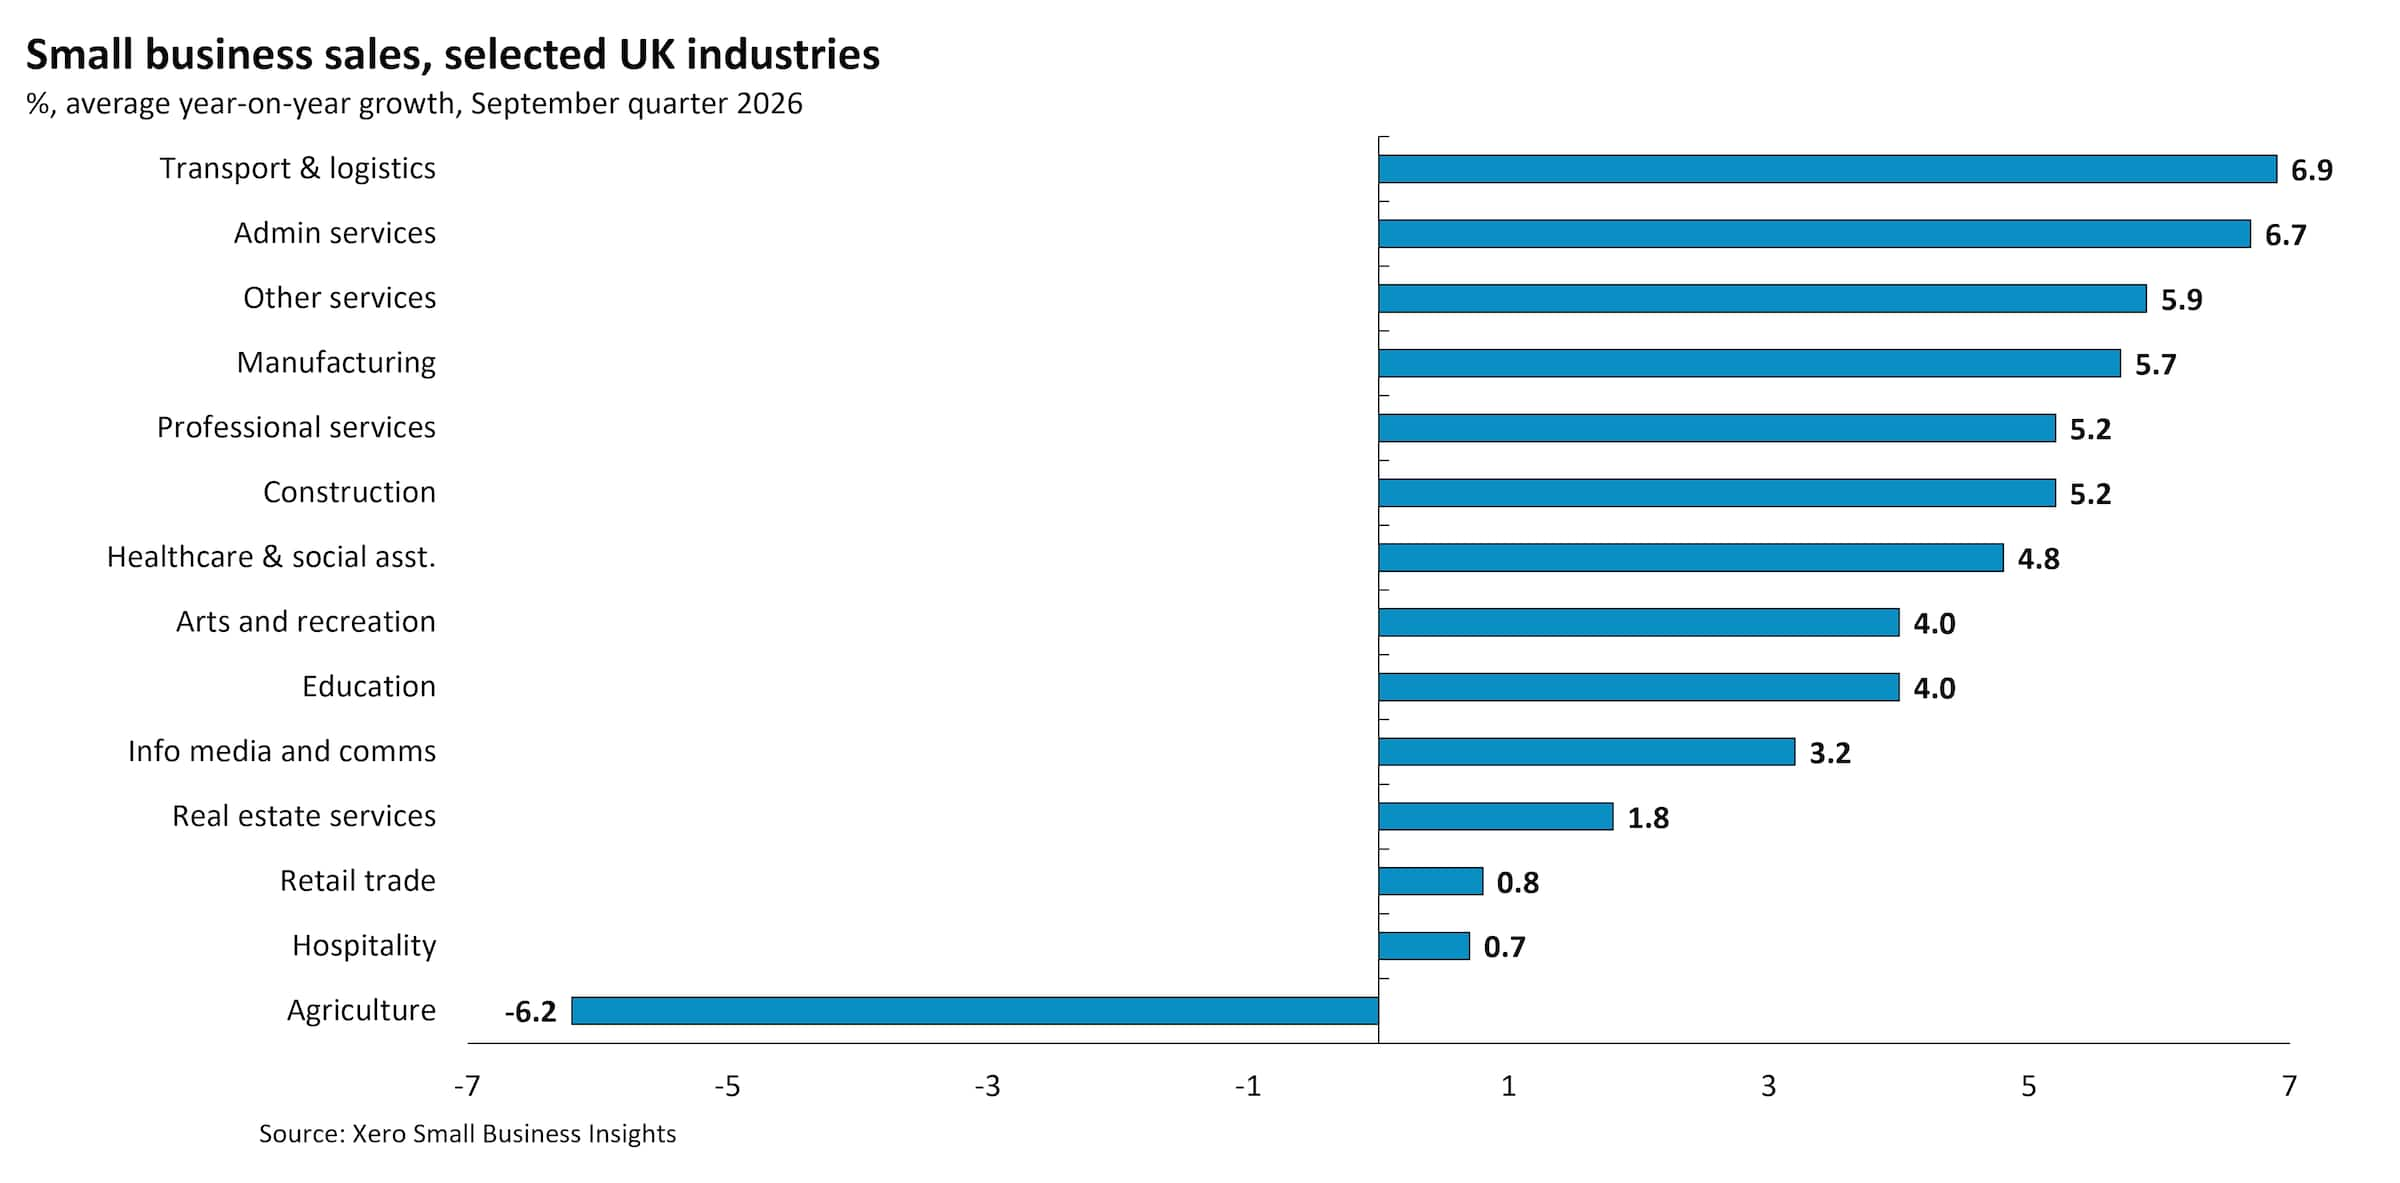
Industry data reveals some small businesses performed well below the national average. The worst performing sector by far was agriculture, where sales fell 6.2% y/y, the second consecutive quarterly decline, amid ongoing drought conditions. Hospitality (+0.7% y/y) and retail trade (+0.8% y/y) both had sales only just above year ago levels, likely reflecting the discretionary nature of some spending in these businesses. In contrast, other services (which includes hairdressers, beauticians and funeral directors) had a 5.9% y/y increase in sales. The strongest performing industry was transport and logistics (+6.9% y/y) likely due to raising prices, amid high fuel costs, rather than volumes. Other industries that performed above average included administrative services (+6.7% y/y), other services (+5.9% y/y), manufacturing (+5.7% y/y), professional services (+5.2% y/y) and construction (+5.2% y/y).
There was less variation across the UK regions, than industries, in the quarter. Gains were led by Northern Ireland (+5.1% y/y), East Midlands (+4.6% y/y) and London (+4.4% y/y). The smallest sales rises were recorded in Wales (+2.3% y/y), the South West and the North West (both 3.3% y/y).
These national results hide significant differences across industries
XSBI UK July 2026 - Sept 2026 data
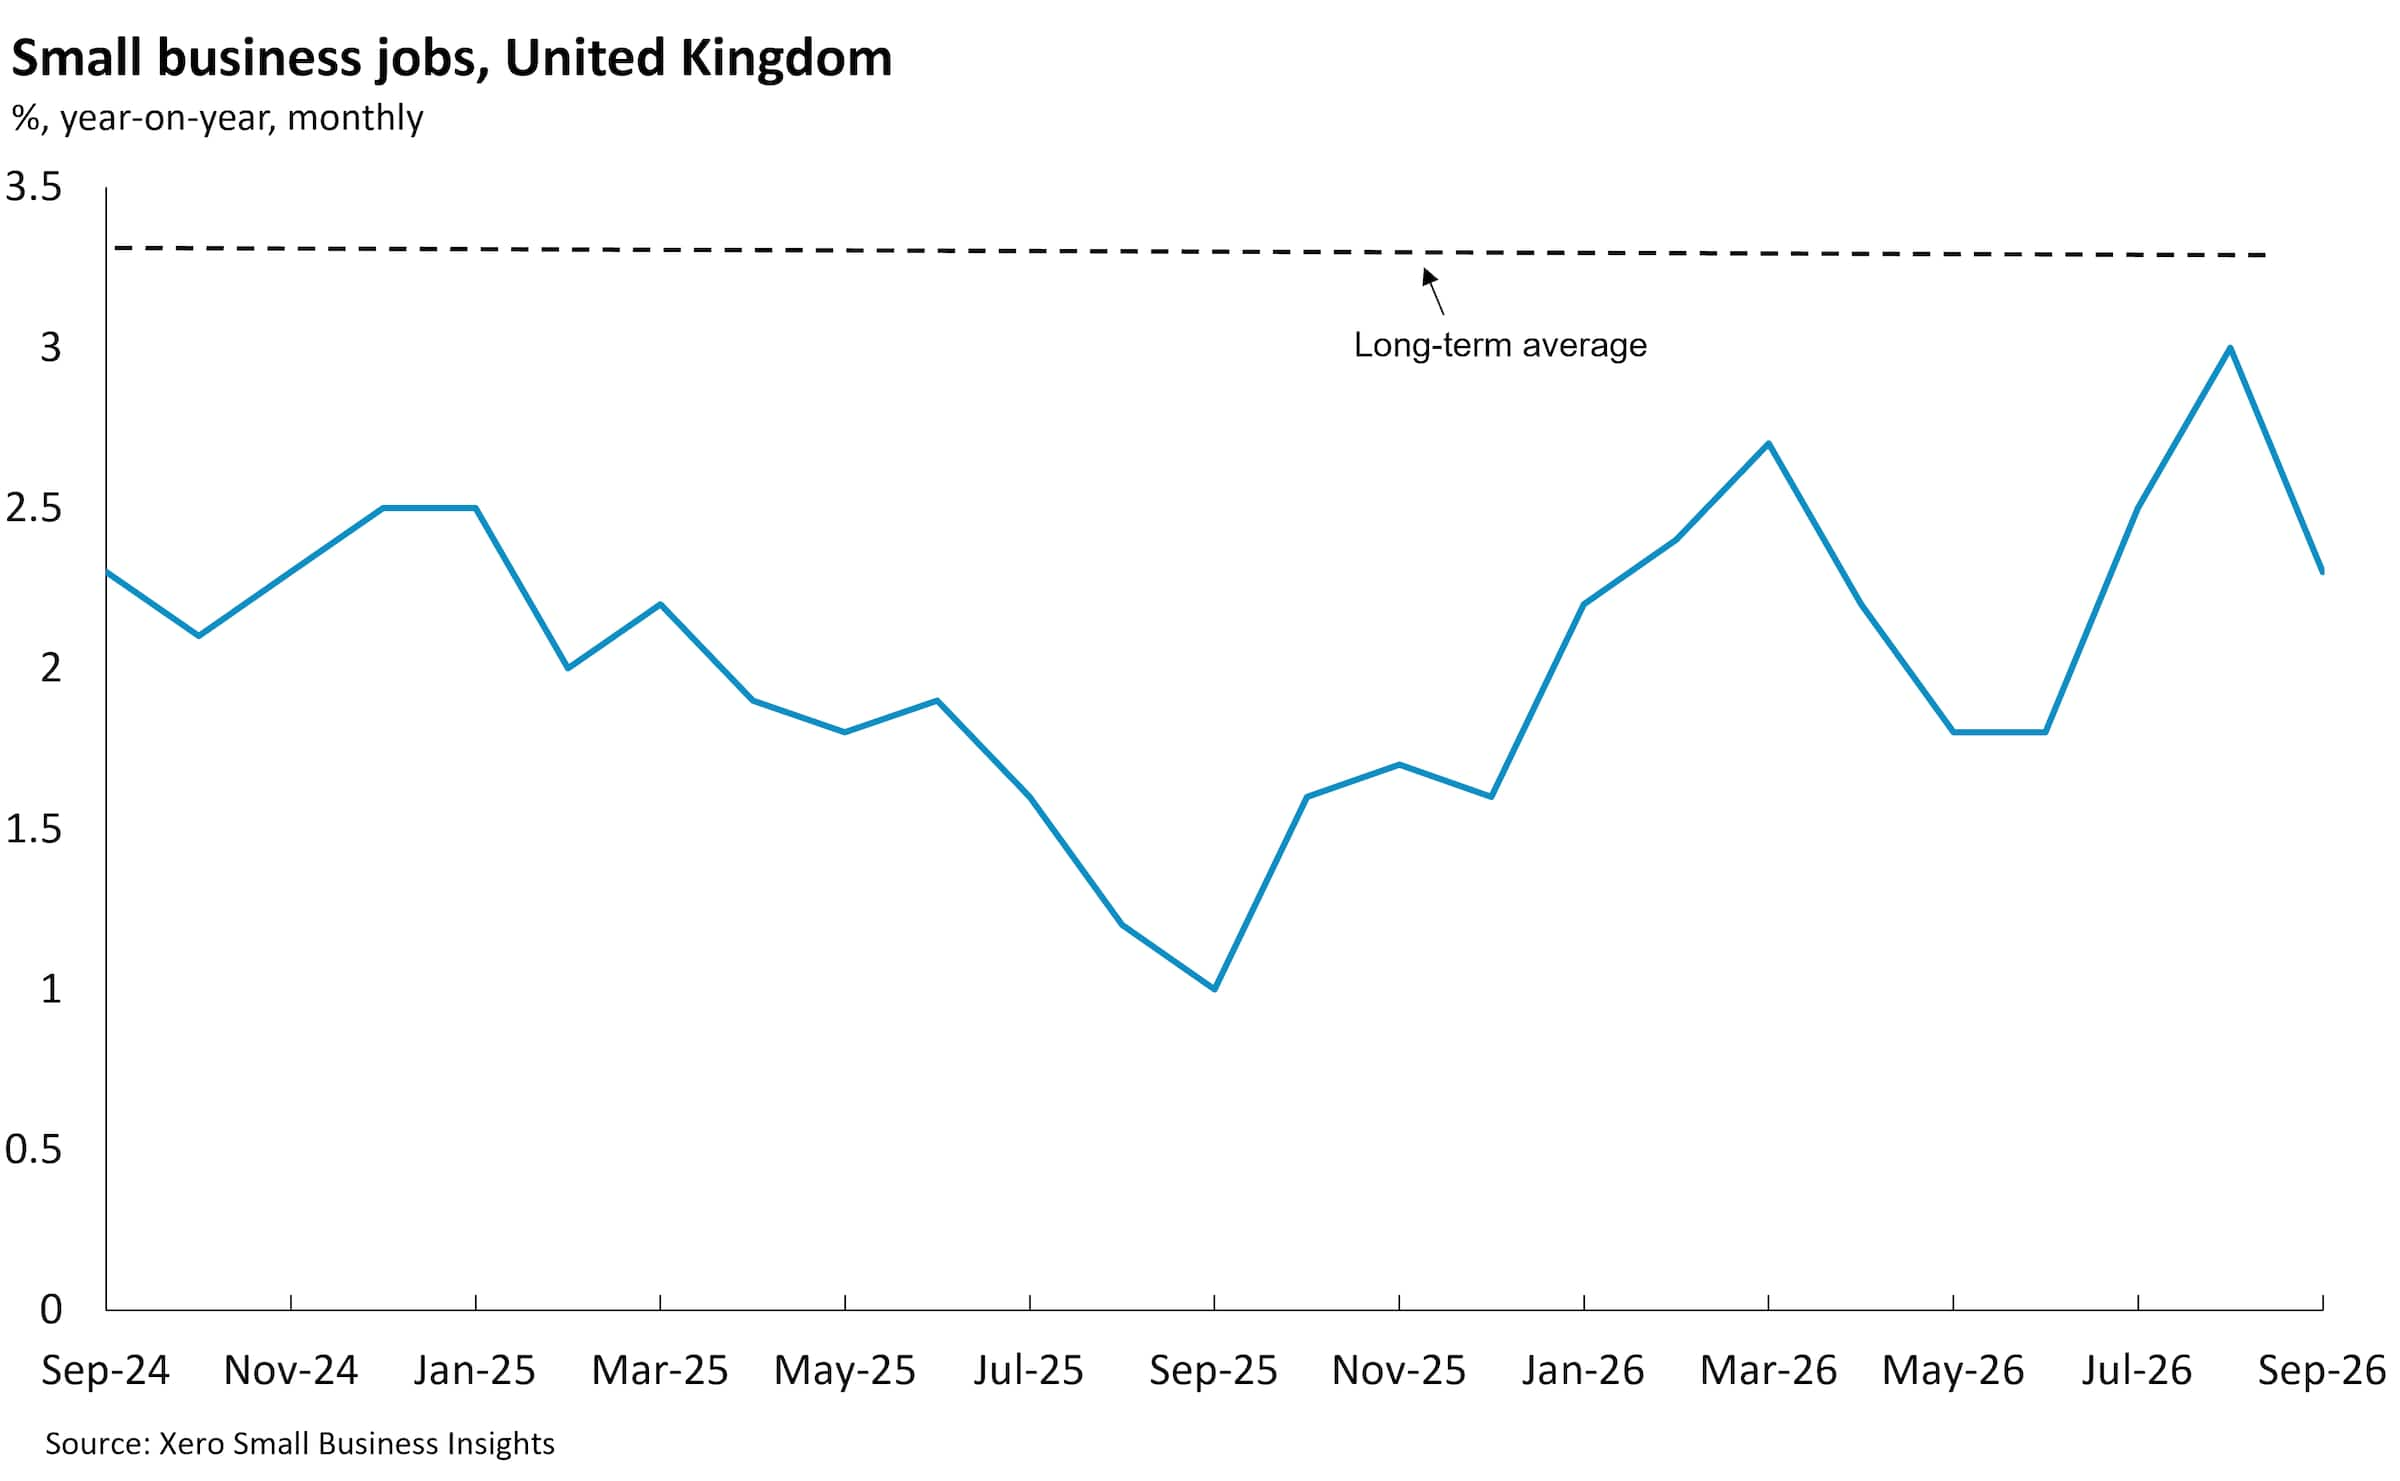
Labour market indicators were mixed, with improved jobs growth but slower wages growth. Jobs rose 2.6% y/y in the September quarter, up from 1.9% y/y in the June quarter but still below the 3.3% y/y historical average. Despite having some of the softest sales performance, retail trade (+5.2% y/y) and agriculture (+4.6% y/y) had the two of the biggest increases in jobs in the quarter. Healthcare and social assistance jobs growth was also strong (+4.4% y/y). Information, media and telecommunications jobs fell 3.4% y/y, the third consecutive quarterly decline. Hospitality (+1.5% y/y) and professional services (+1.8% y/y) both had only small job gains in the quarter.
As with sales, Northern Ireland (+4.2% y/y) had the strongest jobs performance in the quarter, followed by the North West (+3.6% y/y) and London (+3.4% y/y). The North East (+0.1% y/y) just managed jobs than a year ago, with Wales (+1.2% y/y and West Midlands (+1.5% y/y) also having smaller jobs growth than other regions.
Wages in small businesses grew 2.5% y/y, down from 2.8% y/y in the June quarter and below the historical average of 3.2% y/y. There wasn't a lot of variation in wage growth across industries. Two industries were below 2% - real estate (+1.8% y/y) and administrative services (+1.7% y/y). Other services (+3.0% y/y) led the gains, followed by education (+2.9% y/y), professional services (+2.7% y/y), hospitality (+2.7% y/y) and arts and recreation (+2.7% y/y).
Small businesses waited to be paid a little longer in the September quarter than in the June quarter. The length of time small businesses waited to be paid was 29.5 days, compared to 28.8 days in the June quarter. Average late payments in the September quarter were 8.0 days, compared to 7.6 days in the June quarter. These slightly longer payment wait times are likely putting some additional pressure on small business cash flows, although these results are equal to or better than the 2025 average so not overly alarming.
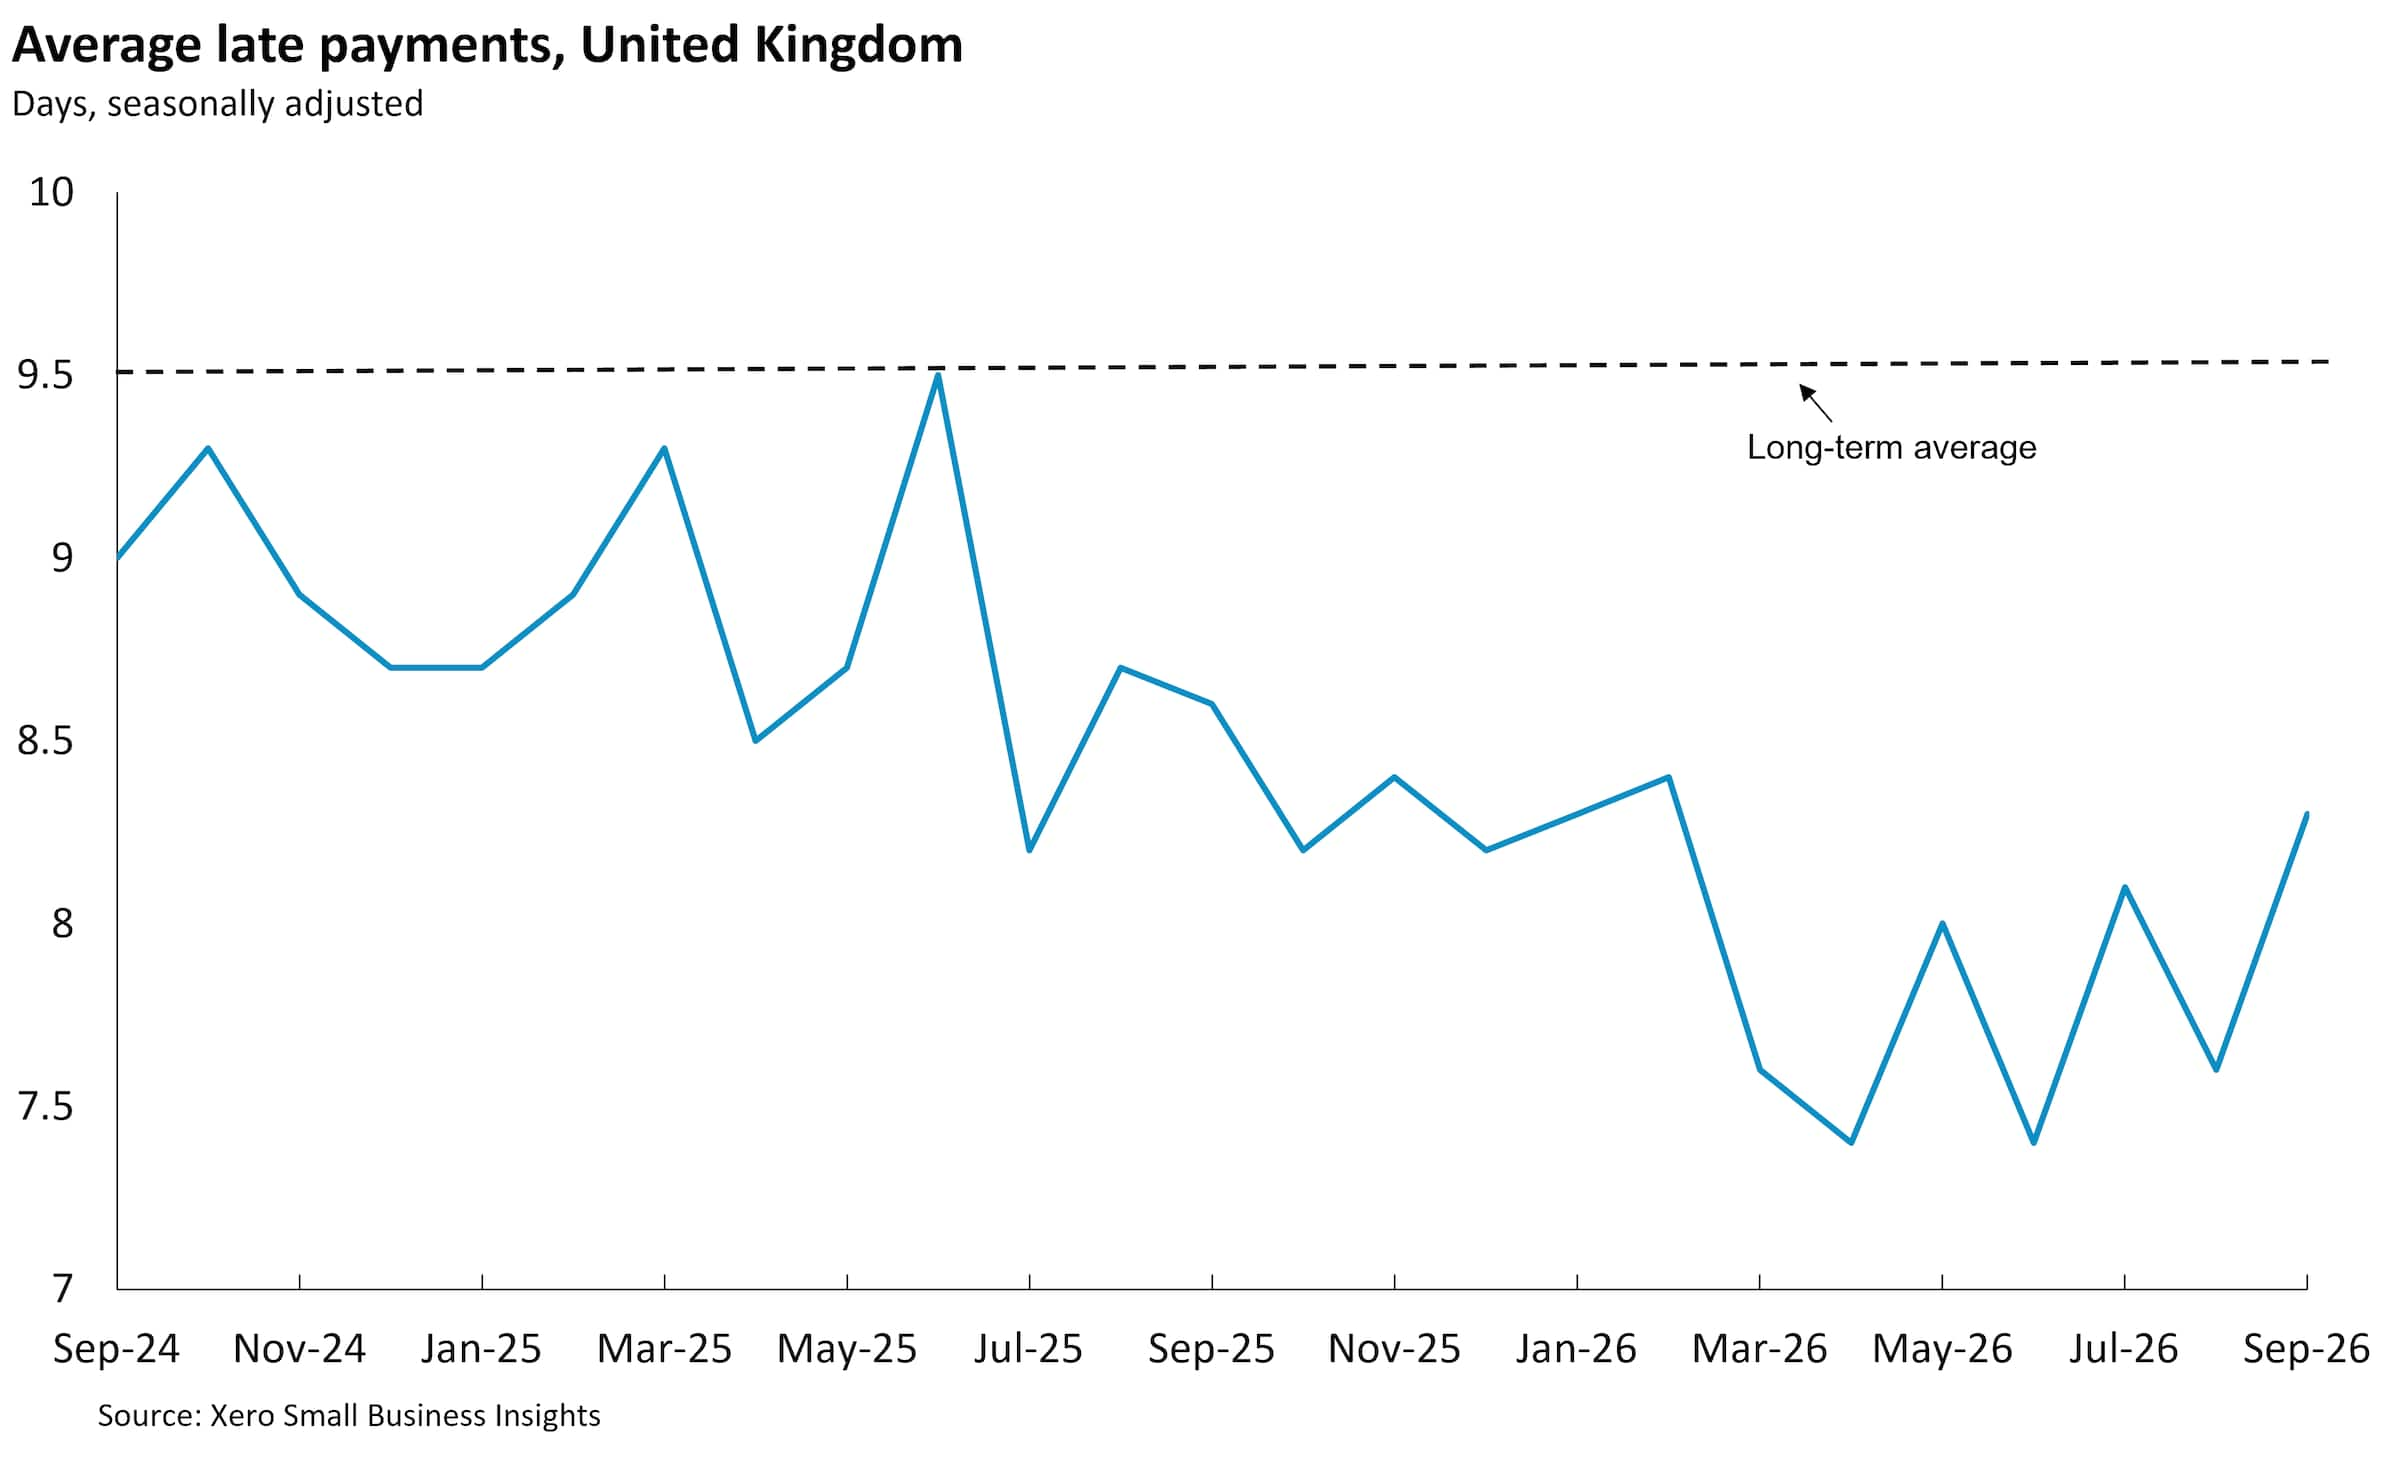
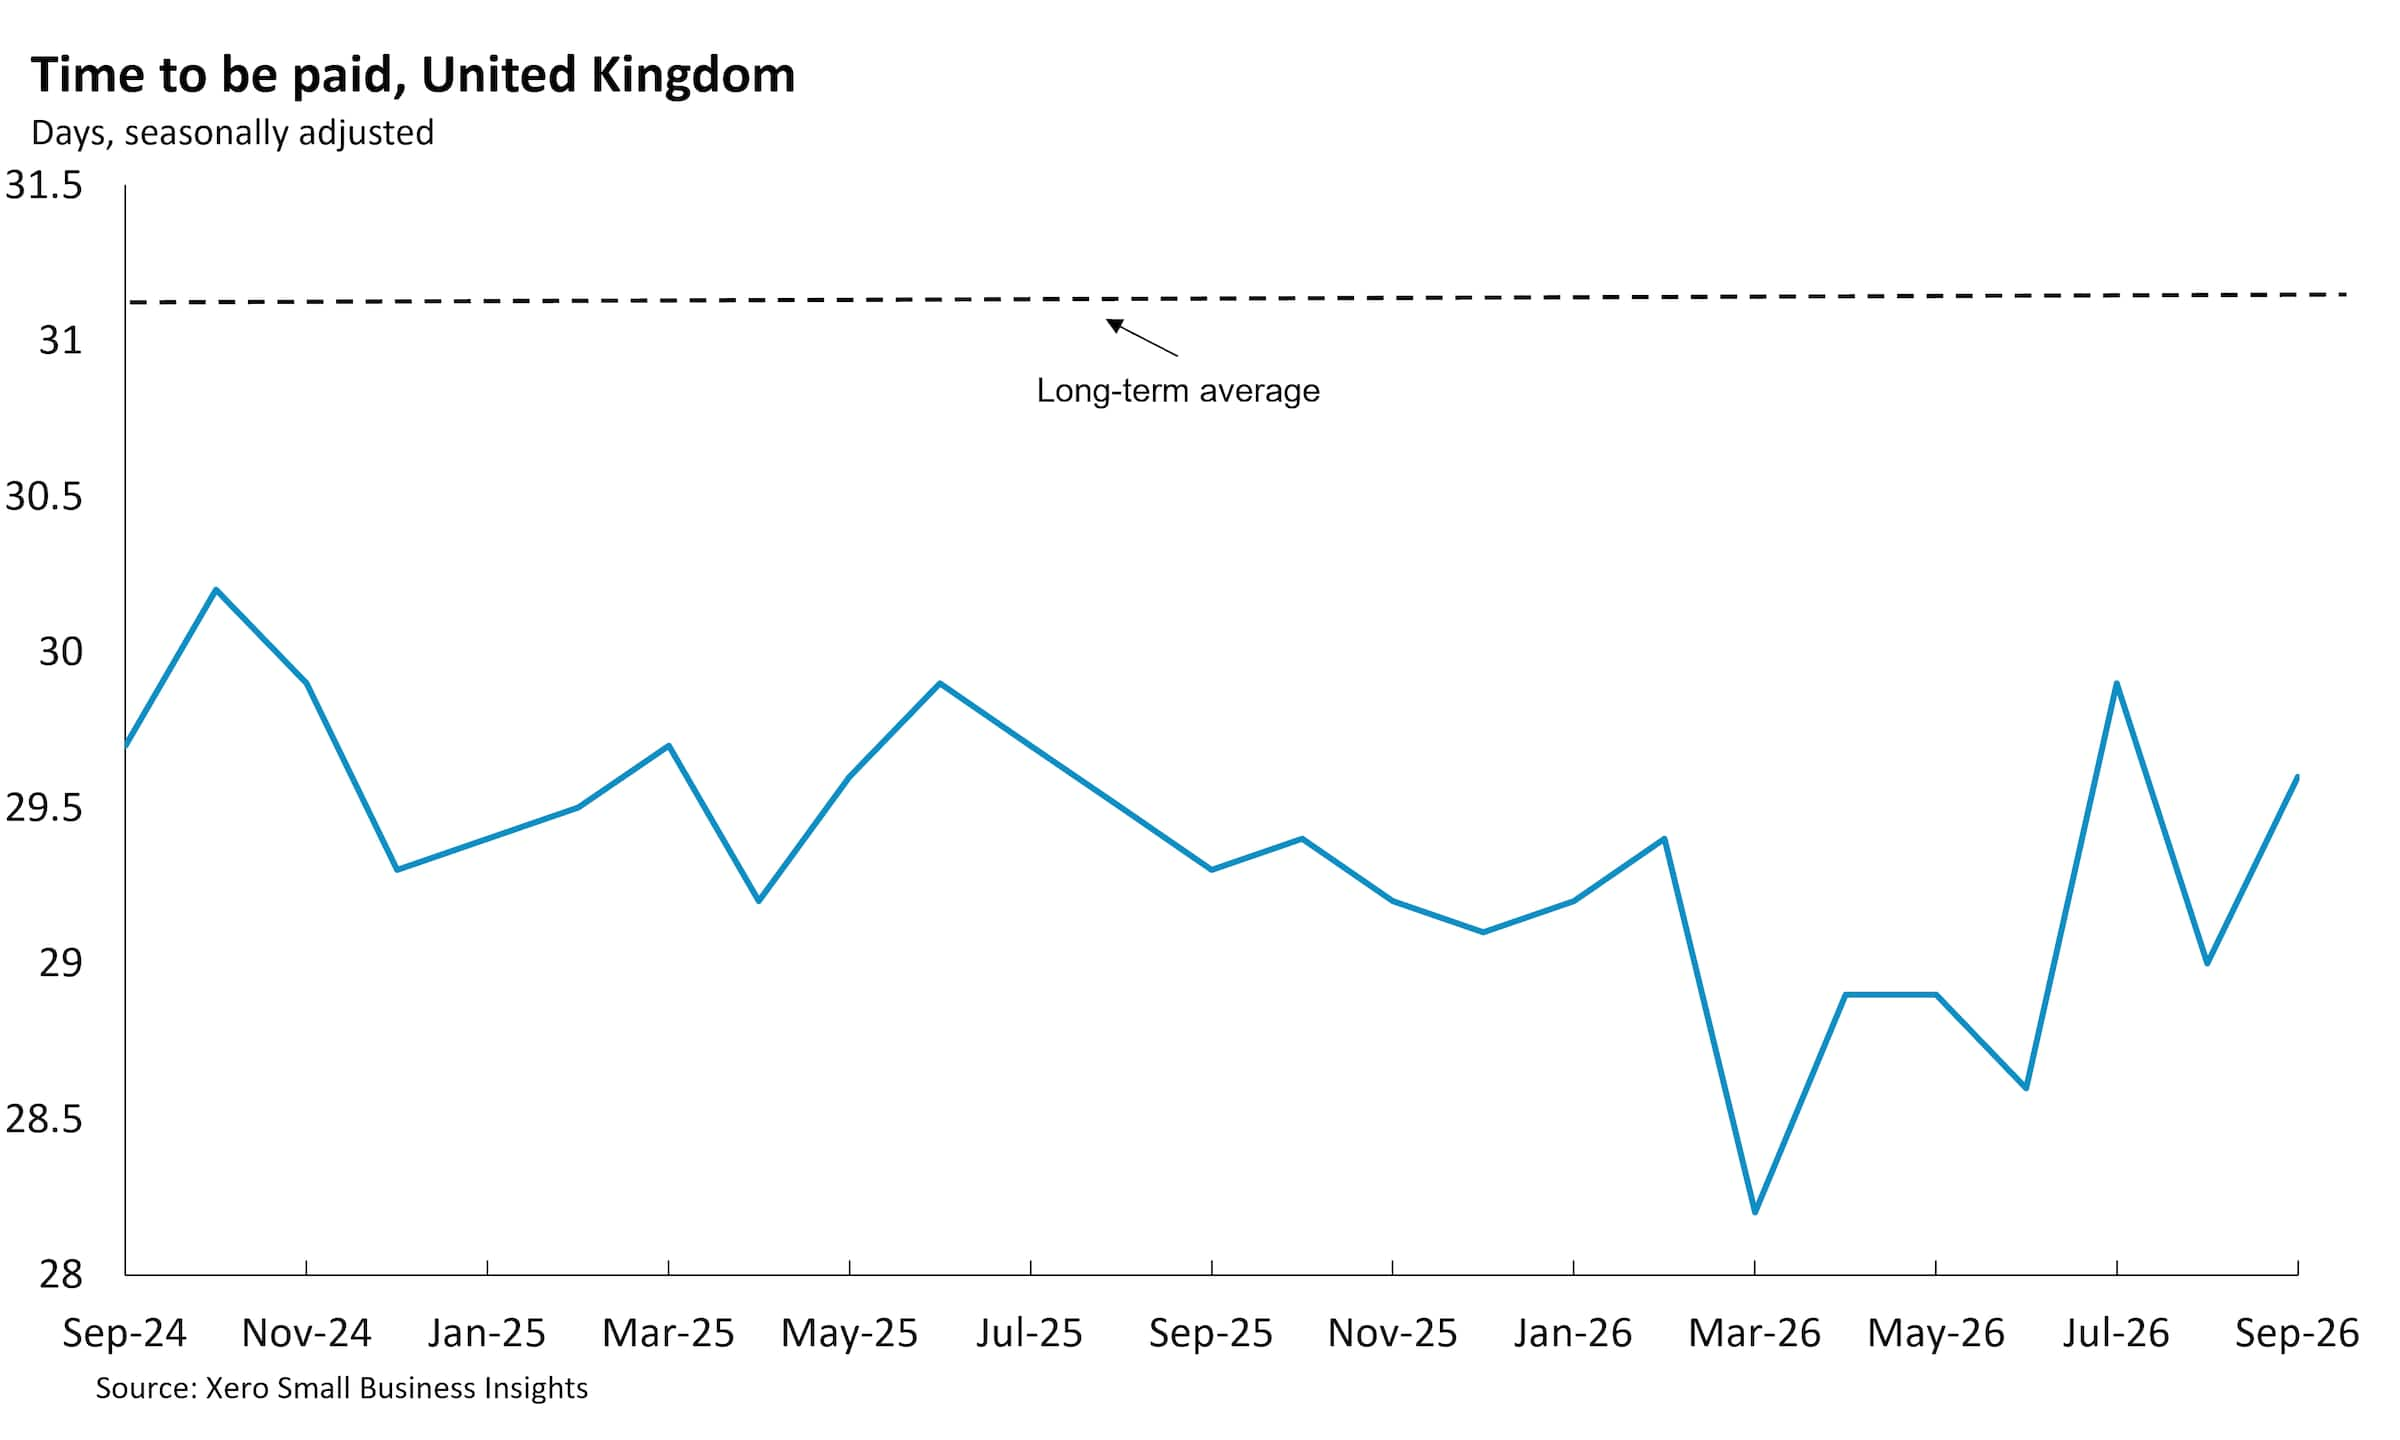
Overall, small business sales lost some momentum in the September quarter and payment wait times became a little worse. Industry and regional data also highlights that some small businesses are facing more challenging conditions than the headline results suggest and others are doing better.
Looking ahead, small business operating conditions are likely to remain subdued over the coming months. Elevated fuel prices and above-target inflation are squeezing household budgets. These pressures could see the Bank of England join many of its counterparts and lift the bank rate by 25 bps to 4% at its November meeting. At the time of writing, financial markets were heavily pricing this in.
The UK economy, like many economies, is currently being dominated by two opposing forces. On the one hand, business investment is being boosted by AI-related building of data centres and their associated fit outs. On the other hand, elevated fuel prices, above-target inflation and a possible increase in the Bank Rate at the next Bank of England meeting are all squeezing household budgets. Aside from some benefits flowing through to small businesses in the construction sector, for most small businesses the negative fuel price and inflation impacts are likely to far outweigh the benefits of data centre building activity.
For more information on the XSBI metrics, see our methodology page.

Disclaimer
This report was prepared using Xero Small Business Insights data and publicly available data for the purpose of informing and developing policies to support small businesses.
This report includes and is in parts based on assumptions or estimates. It contains general information only and should not be taken as taxation, financial, investment or legal advice. Xero recommends that readers always obtain specific and detailed professional advice about any business decision.
The insights in this report were created from the data that was available as at the date it was extracted. Data used was anonymised and aggregated to ensure individual businesses can not be identified.
Find out more about XSBI
If you have any questions about Xero Small Business Insights, reach out to us.